


Investors and advisors must sometimes ask themselves this question: Do hedge funds justify their higher costs with better performance? Well, if we look at the past year's track records, the answer would be no.
Exchange-traded funds (and notes), it can be argued, are better mousetraps, since the best of them capture more alpha than hedge funds do. They are cheaper, to be sure. The average annual holding expense for eight of the largest exchange-traded products using key hedge fund strategies is just 70 basis points. Compare that to the typical "2 and 20" charges-2% of assets and 20% of incremental profits-that hedge funds impose.
Put up against the subsets of the Dow Jones Credit Suisse Hedge Fund Index, the largest publicly traded alternative investments cranked out higher overall returns in 2011 and early 2012.1 While the cost for this outperformance was modest, investors in exchange-traded products did pay up in another way-by accepting higher volatility.
Hedge funds, in other words, were less risky.
That idea seems to contradict commonly held beliefs about these investments. But the reason for the disparity should become clear as we go sector by sector through the hedge fund universe. (See Figure 1.)
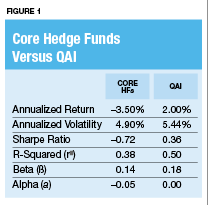
One of the first ETF products to try to replicate hedge fund performance was the IQ Hedge Multi-Strategy Tracker (NYSE Arca: QAI), which has grown its asset base to more than $199 million since its 2009 debut.
This fund tracks an index that replicates the risk-adjusted returns of a broad universe of hedge funds, including long/short equity strategies, global macro approaches, market neutral funds, event-driven investments and fixed-income arbitrage. The QAI fund doesn't own the hedge funds themselves, but instead an assortment of exchange-traded portfolios sporting the iShares, Vanguard and PowerShares brand names, among others. This fund-of-funds adds about 38 basis points in costs, making it one of the most expensive products in the exchange-traded universe.
The QAI portfolio first screens U.S.-listed ETFs for their asset class exposure and liquidity. Their correlations to hedge fund returns are then ranked, and various combinations-subindexes, really-are created after they are back-tested.
Currently, the fund tilts heavily toward fixed-income securities. The iShares iBoxx Investment Grade Bond ETF (NYSE Arca: LQD)-at nearly 24% of the QAI product's holdings-is the heavyweight asset, followed by an 11% commitment to the iShares Barclays Capital 1-3 Year Treasury Bond ETF (NYSE Arca: SHY) and an 8% weighting in the Vanguard Short-Term Bond ETF (NYSE Arca: BSV). While currencies, non-U.S. equity and gold exposures are among the top 10 constituents of the QAI portfolio, bonds make up nearly two-thirds of the top spots.
The focus on debt accounts for both the QAI fund's outperformance and for its volatility and beta readings, which are on par with those of the core hedge fund universe. In short, the exchange-traded product's done a better job of giving investors a low-volatility-and low-cost-play for these uncertain times than most private placement funds. (See Figure 2.)
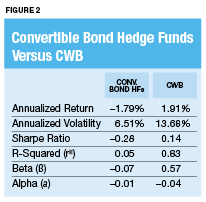
In an environment of low yields and high stock volatility, many investors seek a haven in convertible bonds. These instruments offer characteristics of both the debt and equity markets, and because of their convertibility, they show a stronger correlation with equity markets than vanilla bonds. When held long, convertible securities offer much of the underlying common stock's upside potential while providing better downside protection.
Holding convertibles for the long term is the raison d'être for ETFs like the SPDR Barclays Capital Convertible Bond ETF (NYSE Arca: CWB). With $872 million under management, the CWB fund is the largest exchange-traded product in the convertible space.
Convertible hedge funds instead tend to focus on shorter-term arbitrage plays. This difference accounts for a lot of the disparity in the performance statistics. In particular, the CWB fund's higher volatility arises from its tighter correlation to the long-only S&P 500. While the fund outperformed the convertible hedge fund index in absolute returns, the ETF's beta-adjusted performance-reflected in its alpha coefficient-was actually worse. (See Figure 3.)
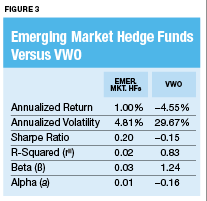
Emerging markets have plummeted over the past year, led by heavy losses in Brazil and India on fears of rising inflation, weak export demand and tightening monetary policies. Typically, these markets are more volatile than the domestic equity landscape, and when investors fear risk, they run for cover from foreign bourses. BRICs, in particular, got whacked last year as the U.S. dollar became a safe-haven play.
For that reason, passive, long-only portfolios, like the $53 billion Vanguard Emerging Markets ETF (NYSE Arca: VWO), backpedaled nearly 5% for the year (the VWO fund's portfolio weighs in with a 10% exposure to Brazil and a nearly 6% allocation to Indian equity). Meanwhile, actively managed hedge funds nimbly avoided losses. (See Figure 4.)
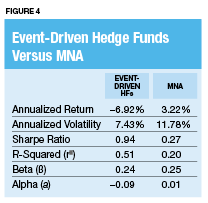
It shouldn't be surprising that several hedge funds are built around merger and acquisition plays, since mergers are the most common arbitrage opportunities. And so it's also no wonder that exchange-traded funds have moved into this space.
The $26 million IQ Merger Arbitrage ETF (NYSE Arca: MNA), first floated in 2009, is the granddaddy of such portfolios. This fund invests in global companies for which a public announcement of a takeover has been announced. (As a hedge, the fund's underlying index also includes short exposure to global equities.)
Because the fund doesn't speculate on deals, it doesn't capture the big rallies a target stock typically enjoys after a takeover announcement. But that doesn't necessarily mean it underperforms. Actually, it offered a slight positive alpha over the past year, while the index of M&A hedge funds lost ground. Oddly, the R squared of the IQ Merger Arbitrage ETF is lower than the hedge fund benchmark's, prompting the question: "Which is really the hedge-the exchange-traded fund or the private placement product?" (See Figure 5.)
Many hedge funds specialize in fixed-income arbitrage. Some focus on swap-spread arbitrage, which involves betting on the direction of credit default swap rates relative to instruments such as Treasurys, gilts or LIBOR. There is also capital structure arbitrage, which exploits the pricing differences on various securities tied to a company, such as its debt and stock.
Then there's yield curve arbitrage. Of all fixed-income arbitrage trades, riding the yield curve is probably the most popular. The Treasury curve, in particular, has become a market focus since the Federal Reserve announced its intent to swap some of its short-term paper inventory for longer-dated obligations under the quaintly named "Operation Twist."
Operation Twist should, in theory, drive down 10-year note rates, and since many loans-such as mortgages-are keyed off these Treasurys, it should also lower long-term borrowing costs across the board. In other words, the swaps should flatten the yield curve.
Judging by the performance of the iPath US Treasury Flattener ETN (NYSE Arca: FLAT) over the past year, that's precisely what's happened. The FLAT note is the mirror image of another Barclays product-the iPath US Treasury Steepener ETN (NYSE Arca: STPP)-which tracks the performance of the Barclays Capital US Treasury 2Y/10Y Yield Curve Index. The index simulates a long position in CBOT 2-Year Treasury Note futures set against a short sale of CBOT 10-Year Treasury Note contracts. The STPP note makes money when the spread in Treasury yields widens (or as the yield curve steepens) while the FLAT product's performance turns positive when the spread narrows or flattens.
During economic recoveries, the yield curve typically becomes less acute as the Fed ratchets up short-term rates. Not surprisingly, the curve steepens when the central bank pushes short rates down in economic downturns. Interest rate spreads can also widen in response to higher inflation expectations.
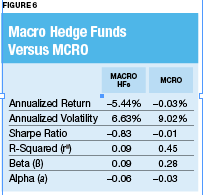
Historically wide spreads and the much ballyhooed Fed swap have made the FLAT note an attractive option to two sets of investors-those confident about a recovery and those worried about the prospects of deflation. In the latter case, long rates have farther to fall than the coupons on shorter maturities. And in a recovery, the Fed snugs up the short end of the curve, but has comparatively little direct impact on long-dated paper. In both cases, the yield curve tends to flatten. (See Figure 6.)
Global macro funds opportunistically invest in markets through a variety of equity and debt instruments, currencies or commodities. These bets may be outright and directional-say, long U.S. Treasurys-or they could be relative value plays such as currency pairs (long on the yen and short on the euro, for example).
Global investors wary of turmoil have sought refuge in the U.S. greenback, weakening the developed and emerging markets typically targeted by macro fund managers. This is reflected in the negative returns for the macro hedge fund universe as well as the IQ Hedge Macro Tracker fund (NYSE Arca: MCRO), an amalgam of bond, currency, emerging market and precious metals exposures.
Like the IQ Hedge Multi-Strategy Tracker, the MCRO product owns no hedge funds. Instead, it's made up of other ETFs and thus passes through a hefty dollop of management fees to investors. Still, the MCRO fund's expense ratio is half that of the hedge funds. And there's no incentive fee. (See Figure 7.)
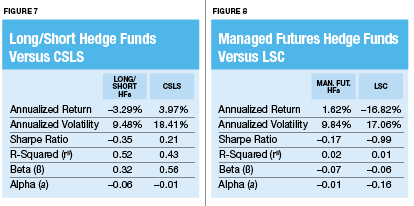
Long/short fund managers, it goes without saying, hold long positions in undervalued stocks and sell short overpriced equities. Generally speaking, the funds' long sides outweigh their short exposures, though there's a small contingent of hedge funds with a short bias.
Long/short didn't work well for the hedgies last year. One exchange-traded note did see some success: the Credit Suisse Long/Short Liquid Index (Net) ETN (NYSE Arca: CSLS), which enjoyed a modest gain. But the CSLS note's risk-adjusted performance fell slightly short of the long-only S&P 500. Better than the universe of hedge funds, to be sure, but still a negative alpha. To boot, holders of the ETN assumed the credit risk associated with a senior, unsecured obligation of Credit Suisse AG's Nassau branch (rated a somewhat shaky 'Aa1'). (See Figure 8.)
Managers of hedge fund strategies and exchange-traded products also look for opportunities by plumbing the futures market. Commodity trading advisors (CTAs) can be opportunistic or momentum followers and pursue either broad-based strategies or focus specifically on areas such as metal and agriculture. And, of course, CTAs can sell a market short as easily as they take a long position.
One of the first exchange-traded products to mimic a managed futures account was the ELEMENTS S&P CTI ETN (NYSE Arca: LSC), launched in mid-2008. The LSC note tracks a rules-based long/short index with 16 commodity futures contracts across six sectors. Any sector can be long or short except for energy. (The S&P Commodity Trends Indicator dictates either a long or flat position-never short.)
The positions in the note's underlying index are adjusted according to individual commodity trends at month's end. The Commodity Trends Indicator relies on a seven-month moving price average: When a commodity's price ends the month above the average, it's held long; when it's below, it's shorted (or, in the case of energy, left alone).
The restriction on short energy positions accounts for the LSC product's significant underperformance. Commodity trading advisors could have exploited the steep selloff in oil prices in 2011, an opportunity denied because of the Commodity Trends Indicator's methodology.
Wrap-up
Despite their aggregate negative returns over the past year, privately placed hedge funds have delivered on their promises of low correlation (to large-cap domestic stocks, anyway). The average 2.75% annual return of the eight hedge fund subindexes came with an annualized risk of 6.75% and an r2 correlation of 0.20.
Leading ETP mimics earned an average 1.12% annual return with a much more market-like volatility of 14.97%, yielding a 0.46 r2 coefficient. (See Figure 9.)
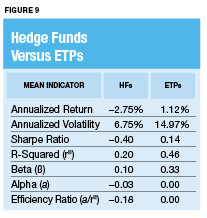
To sum up, hedge funds may have delivered negative alpha, but they did so with less systematic risk. First-to-market ETP replicas, on a risk-adjusted basis, did no better-but no worse, either-than the S&P 500.
So, which investment was better? That question is, perhaps, best answered by the efficiency ratio that divides the investments' alpha by their r2 correlations. By this measure, a negative is still, um, a negative.
Upon their introduction, hedge replica ETPs were met with skepticism. These products, by and large, have since gained some traction. In addition to their lower cost profiles, hedge fund ETPs offer significantly lower investment thresholds, better transparency and the benefit of regulatory oversight.
More important, though, they offer better bottom-line results.