2016 is likely to be a difficult year for investors. Read that sentence carefully. We think 2016 might be a difficult year for investors ... not necessarily for investing.
Our core theme of the past six years, that the U.S. may be in one of the biggest bull markets of our careers, remains intact. 2016, though, may be a year during which investors need blinders and earplugs to successfully invest.
The Presidential Election -- Be Prepared For A Wave Of Negativism
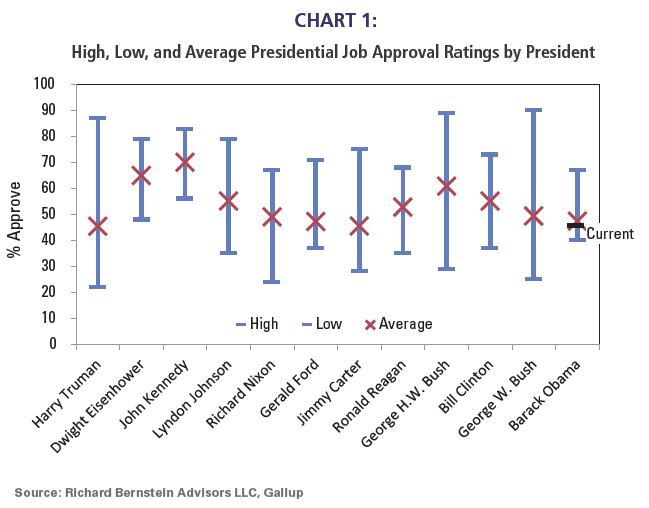
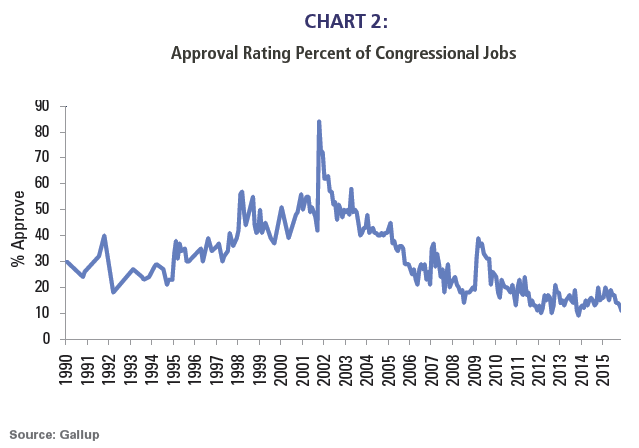
It seems certain that the eventual Republican and Democratic candidates for president will not run on status quo platforms. The current president’s approval rating remains low (see Chart 1), as does Congress’s (Chart 2), so the candidates will probably distance themselves from current policies. “Be scared, but trust me” is hardly a new or original campaign tactic, but given Washington’s historically low approval ratings, it seems certain that negative campaigning will be very loud.
Investors Must Be Dispassionate
Investors must remain dispassionate during 2016, despite the inevitable political fearmongering and consternation during the upcoming year. Taking advantage of misperceptions of U.S. fundamentals fostered by both parties’ campaigns could significantly add to 2016 portfolio performance. With that in mind, our “year ahead” report highlights some basic objective observations that show significant gaps between political perception and reality.
Could the economy be better? Of course it could. That’s not our point. Our point is simply that investors must always separate political propaganda from the true underlying fundamentals. The upcoming election could present significant investment opportunities if the campaigns (both Republican and Democratic) ignore the already improving trends of U.S. fundamentals.
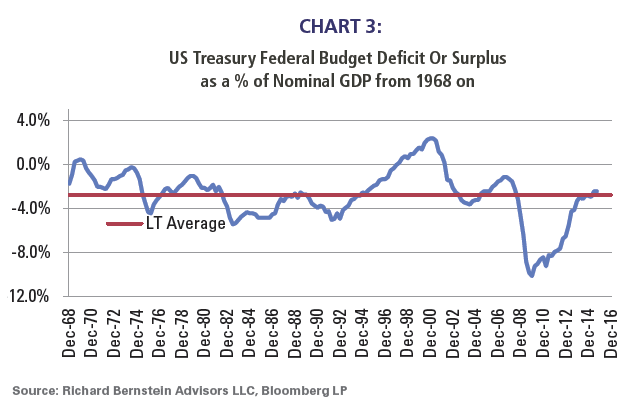
The budget deficit -- better than normal. The budget deficit is much more cyclical than many investors realize. Chart 3 shows the budget deficit as a percentage of GDP (not scaling the budget deficit to the size of the economy is meaningless). During the last recession, the budget deficit expanded to 10% of GDP because spending was increasing and GDP was decreasing. Today, most investors seem unaware that the budget deficit has decreased from 10% of GDP to only about 2.5%, which is actually smaller than the long-term average. In other words, the deficit as a percentage of GDP is now better than normal.
The smaller deficit is simply attributable to the combination of cyclical improvement in the overall economy with cyclical reductions in spending.
Workers – Better than normal
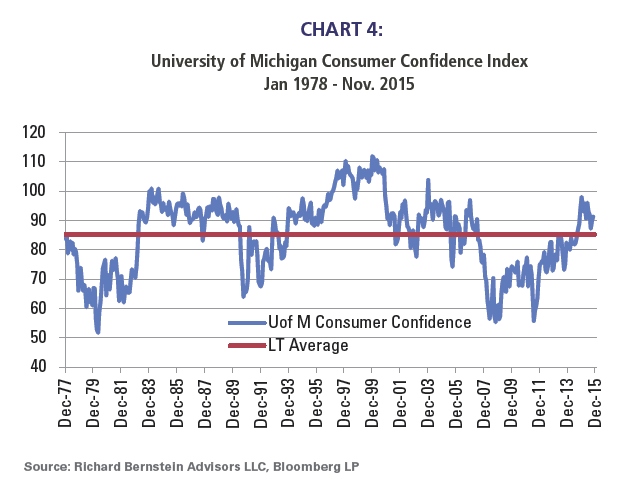
Some observers claim that workers are under intense pressure, but the data does not support such contentions. Objective surveys of consumer confidence presently show that consumers believe their status is better than the long-term average (Chart 4). It seems hard to argue that households are in terrible shape when they assess their own conditions as being better than normal.
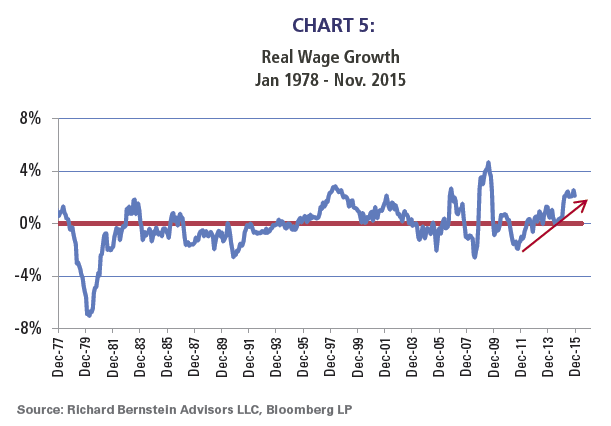
Real wage growth may be one reason consumers may not be as concerned as politicians say they should be. Average hourly earnings are currently growing 2.3% over the last 12 months, admittedly less than the long-term average of 3.6%. However, real wage growth (i.e., a measure of purchasing power) is near a cycle high (Chart 5). Although one could argue that wage growth should be faster, purchasing power is the strongest in 6 years and among the strongest in history.
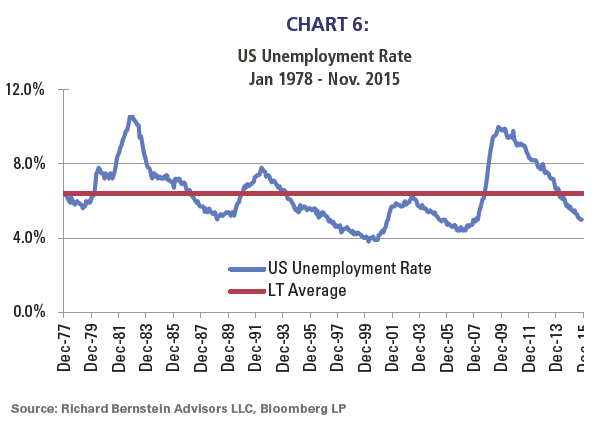
Unemployment is also much better than the long-term average. Chart 6 shows that the current unemployment rate of 5.0% is considerably better than the long-term average of 6.4%.
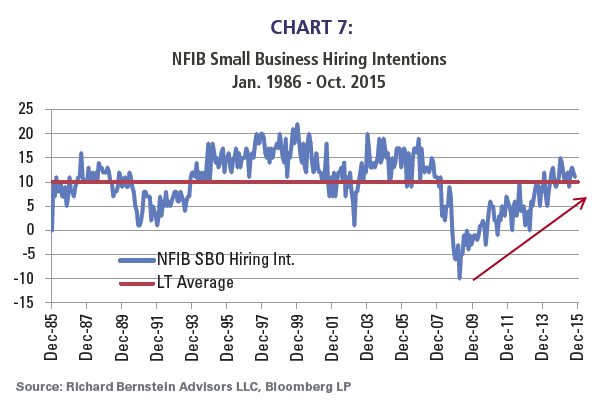
Small Business – Better than normalSmall businesses also seem to be in better shape than politicians would lead one to believe. Chart 7 shows the NFIB Small Business Hiring Intentions Survey. It, too, is above its long-term average. In other words, small businesses are intending to hire more people than normal. We doubt this would be the case if small businesses were faced with the adverse business conditions that some politicians have cited.
Market volatility – Normal
Academics define risk as the volatility or unpredictability of returns. A more practical definition might be the probability of a loss or the probability of returns falling below some required return (i.e., 5% real return for a foundation). We incorporate this definition of risk in many of our models and analyses.
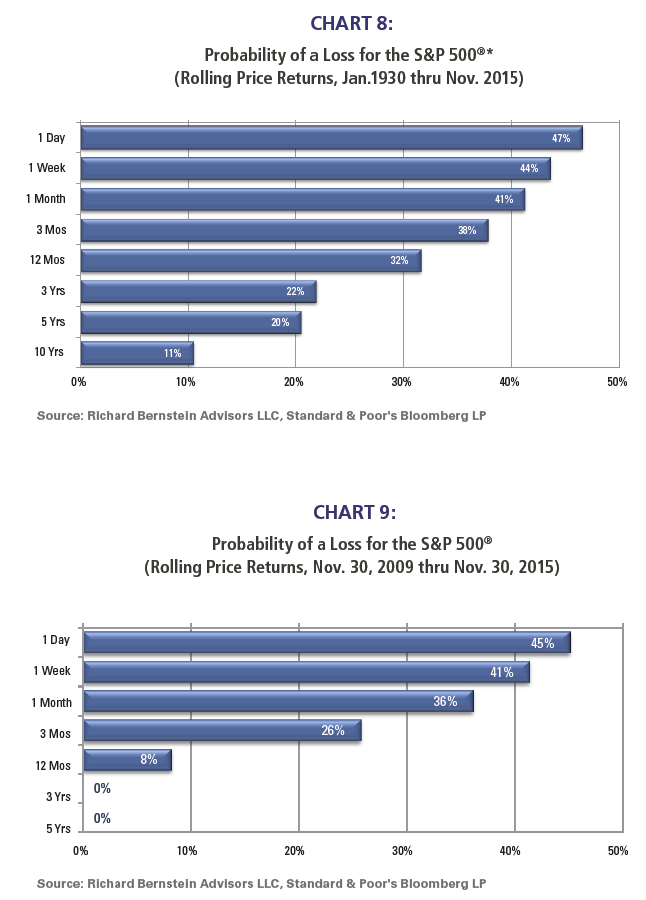
Chart 8, one we have published many times, shows the historical probability of a loss when investing in the S&P 500. The probability of a loss decreases as one extends investment time horizons because longer time horizons are influenced more by fundamentals and less by noise.
Chart 9 shows similar data for the current bull market. The higher frequency statistics for the current bull market are virtually identical to those of historical bull markets. Data during the current cycle does not support claims that the US stock market is much more volatile and risky than it was in past cycles.
U.S. dollar – Not even close to becoming the Peso
Those who invest with us know we have been US dollar bulls for quite some time, and have been hedging foreign currency exposure in many of our portfolios. Our view is very out-of-consensus because there remains a loud chorus that the USD is becoming a third world currency because of misguided monetary and fiscal policies. Rather than weakening, though, the dollar has been secularly appreciating.
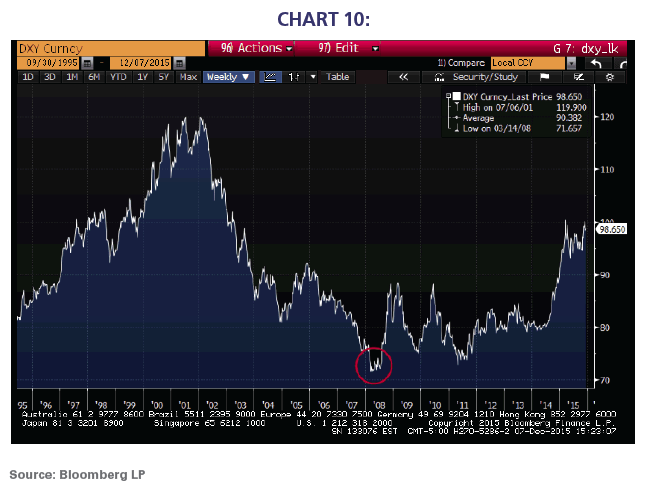
Chart 10 shows the tradeable DXY Index, which is based on a basket of major foreign currencies and incorporates investors’ expectations. The trough in the DXY was actually during the Spring of 2008. That’s correct. The U.S. dollar has been appreciating for more than seven years!
There will likely be many opportunities in 2016We continue to invest dispassionately and objectively, and think that approach could be vital to portfolio performance during 2016. Both parties’ naysayers will likely be loud, but, as these charts show, the U.S. economy appears rather healthy. The bull market has been supported by that improving health, and we expect those trends to continue during 2016. Investors will need to realize and act on the gaps between political rhetoric and reality.
About Richard Bernstein Advisors
Richard Bernstein is CEO and chief investment officer of Richard Bernstein Advisors LLC, an independent investment adviser. RBA partners with several firms including Eaton Vance Management and First Trust Portfolios LP, and currently has $3.2 billion collectively under management and advisement as of November 30, 2015.