


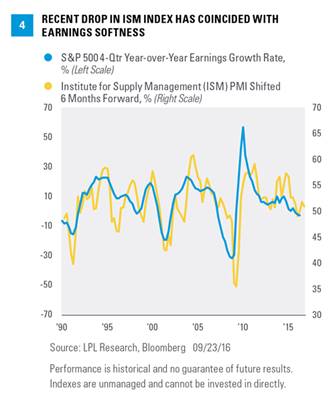
Earnings are the most fundamental driver of the stock market, and therefore, should be a part of any recession or bear market watch checklist. The Institute for Supply Management (ISM) Manufacturing Index has historically been a good earnings indicator, with a 6-month lead time [Figure 4]. For example, the peak in the ISM that occurred in late 2014 did indicate an ensuing slowdown in profits. The ISM is an association of purchasing and supply management professionals who are surveyed each month to assess their future plans; the results of the survey are then used to create an index. Because purchasing managers are on the front line when it comes to the manufacturing supply chain, they can provide signals ahead of economic turning points. With about two-thirds of S&P 500 profits tied to manufacturing, manufactured goods demand has been a timely barometer of all types of economic activity in recent decades.
Currently, this indicator is signaling a continued earnings lull and is one to watch closely. The latest August 2016 reading was 49.4 (below 50, which indicates contraction). Pulled down by energy sector weakness and a strong U.S. dollar, we believe this weakness is temporary and that readings will soon return to expansion territory. We expect this latest period of earnings weakness to end up resembling the mid-cycle dips experienced in the mid-1980s, mid-1990s, and 2012, periods when the ISM dipped below 50 that were not followed by recession.
There are other earnings indicators that have provided early warning signs of recessions such as profit margin peaks and earnings revisions. These measures, which we will explore more in future commentaries, have also triggered more false signals.
Market Breadth: No Warning
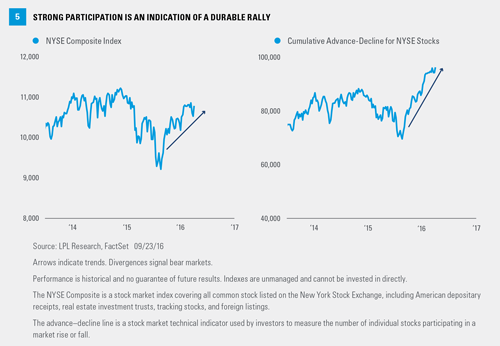
We track market breadth by looking at the number of stocks that are advancing versus declining. By tracking how many stocks are participating in a rally, we can get a sense of how broad and durable that rally may be. A market that is rising on the strength of fewer stocks may be more vulnerable to a decline. If market breadth begins to decline and diverge from the rise in the NYSE Composite Index, for example, and is followed by a decline in the index as it begins to succumb to the dwindling number of stocks in the index that are still rising, the likelihood of a market downturn increases (we use the NYSE Composite because of its many constituents).
Most relevant today, a market that is rising on the strength of many stocks is robust and increases the potential of further gains. This is depicted in Figure 5 by both the NYSE cumulative advance-decline line and the NYSE Composite Index trends rising together over an intermediate-term time horizon. We do not see evidence of narrow or weak leadership, nor of concerning divergences between the index and breadth that might suggest the likelihood of a market downturn has increased.
Stock Valuations: On Watch
The statistical relationship between what investors are willing to pay today for earnings over the past year, as measured by the price-to-earnings ratio (PE), and how stocks perform over the following year, is weak, meaning that stock valuations are poor market timing tools (see Weekly Market Commentary, “Sell Now?”). However, the PE is a good indicator of long-term stock returns and can help tell us when the market has become fully valued and may be more vulnerable to deterioration in the economic cycle. A higher PE implies a more optimistic earnings outlook, which introduces more risk of disappointment if that growth outlook does not materialize.
The stock market’s gains this year have lifted the S&P 500 price-to-earnings ratio (PE) to 18 (on a trailing four quarters basis). Though on the high side of the historical range (top quartile) and above the 35-year average (16.4), this valuation is nowhere near what we saw during the internet bubble [Figure 6]. We would characterize the valuation signal as flashing yellow and are watching the four other indicators discussed here, and others, for a catalyst that would make these valuations more worrisome.
Conclusion
