Is global aging about to end the savings glut? Some observers think so. More and more baby boomers are reaching retirement age, and they will soon not only save less but also start to dump their accumulated assets to fund retirement … or so the story goes. If this were true, the consequences for interest rates would be profound. The real long-term equilibrium interest rate, which has been on a secular downtrend for decades partly due to strong working-age cohorts saving hard for retirement, would start to rise – and what we here at PIMCO call The New Neutral might soon be history.
We strongly disagree with that thesis of an imminent demographics-induced savings drought. Rather, we have argued in recent work that the global excess supply of saving over investment, which has been largely responsible for the secular decline in equilibrium interest rates, is not only here to stay but likely to increase further in the coming years for a host of reasons including demographics (see PIMCO Macro Perspectives, “No End to the Savings Glut,” September 2015). As a consequence, we continue to expect the fundamental forces of elevated desired saving to keep the equilibrium real rate depressed and to limit the extent to which other (cyclical) factors can drive up market interest rates.
However, given the popularity of the thesis that demographics will soon end the savings glut, we undertook a deep dive into the data to investigate the link among demographics, saving behavior and the demand for fixed income assets – with some surprising results. Here’s what we found.
A ‘demographic reversal?’ Not so fast!
People of the world, we’re getting old. It’s a well-known fact that, after decades of decline, the global dependency ratio – traditionally defined as the ratio of individuals younger than 15 and older than 64 to the working-age population aged 15-64 – is now rising (see Figure 1).
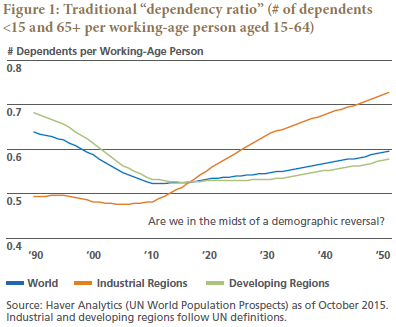
Some financial market observers argue that this demographic trend reversal will begin to drive interest rates higher, and soon. Why? First, a declining share of high-saving workers and a rising share of dissaving elderly will (the argument goes) erode the demand for saving – and drive interest rates higher via the savings-investment equilibrium. Second, these observers argue, a rapidly growing share of retirees will have to consume (i.e., sell down) their financial asset holdings to fund spending in retirement, and these drawdowns will create selling pressure in financial markets that pushes asset prices down and interest rates up.
Our core thesis in a nutshell: Yes, global aging may someday drive U.S. interest rates structurally higher. But “someday” remains at least a decade away – for two reasons. First, we proffer that global saving will remain stronger than many expect, supporting a low global neutral interest rate. (As investors, we care about the neutral rate because it anchors fixed income yields in the market.) Second, U.S. demographic demand for fixed income assets should remain robust until at least 2025 – and in the meantime should continue to put downward pressure on market yields, all else equal. Combine a low global “anchor” and strong domestic fixed income demand, and what do you get? Lower rates for longer in the U.S.
Continuing robust demographic demand for saving
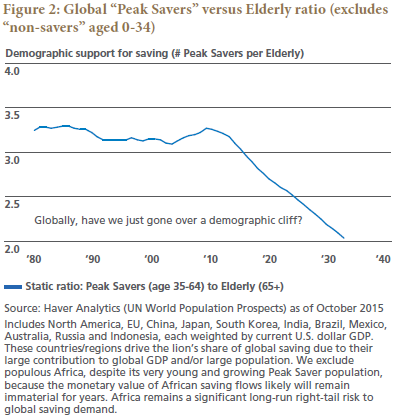
Remember the link between saving and interest rates: In the savings-investment equilibrium, rising demand for saving pushes down the equilibrium (or neutral, or natural) rate of interest, all else equal, and vice-versa. Our task, then, is to assess how demographic changes affect aggregate saving. We find that the traditional “dependency ratio,” used in many other studies on this topic, is flawed. We suggest two modifications to address those flaws. First, the young, considered “dependents,” contribute very little to global saving and dissaving in dollar terms (they’re “non-savers”). We therefore prefer to focus on the ratio of “Peak Savers” (mature adult workers who earn and save a lot) to “Elderly” (who save less as they age and ultimately consume their savings in retirement). Let’s preliminarily define “Peak Savers” as individuals aged 35 to 64, for two reasons:
• People 35–64 have generally exhibited much higher savings rates than people in younger and older age groups;
• People 35–64 earn considerably more income than people younger and older – so for any given savings rate, this age group’s saving behavior will have an outsized effect on saving and investment flows in dollar terms.
Let’s preliminarily define “Elderly” as everyone 65 and older (the traditional definition). Thus, the global Peak Savers versus Elderly ratio in Figure 2 reflects a static 35–64 Peak Saver cohort – and reveals what appears to be a demographic cliff in about year 2010. Those who argue that demographic support for saving will fall sharply in the coming years typically will try to prove their point using a ratio like this one.
But we ask: Is it sensible to define the Peak Saver and Elderly groups by the same static age ranges over long periods of time? Put differently: Might working and saving behavior evolve over time, warranting a dynamically modified dependency ratio? Seniors’ ability to work (and save) later in life should continue to rise; in our increasingly services-based “knowledge economy,” jobs are becoming less physically demanding and often require more experience, while advances in health technology boost functional age in life’s later stages. Seniors’ willingness (and incentives) to work longer also should rise along with their ability.
True, the retirement age, globally, has not kept pace with rising longevity. But policymakers are slowly catching on. In the U.S., the Social Security full-benefit retirement age is increasing to 67 and will go higher still – a government incentive telling people to stay in the workforce. Meanwhile, years of low interest rates have left impending retirees playing catch-up in retirement saving. More generally, around the world, longer lives must ultimately be supported by longer working lives. Anything less will prove unsustainable. Our colleague Jim Moore summed up the state of affairs (in the U.S.) in a PIMCO Viewpoint from 2012: “Work a little longer. Save a little more. Get by with a little less.1
We think this insight applies abroad as well. In fact, global trends already underway support our argument that people will work later and later in life. In many economically important geographies – notably the U.S., eurozone, UK and Japan – senior (age 65+) labor force participation has been trending higher. And China is contemplating steadily raising its retirement age in the coming years.
However, what matters most for global saving demand are those who earn the most income. Consider the U.S. as an example. Top-income-quintile households control nearly two-thirds of U.S. household income, three-quarters of household wealth and more than 80% of household financial assets. Apart from the major social ramifications of wide (and widening) income and wealth inequality, the implications for aggregate saving are critical: Rather obviously, high earners’ working and saving behavior has an outsized effect on global saving in dollar terms. If the highest earners are working (and saving) later in life, we should pay attention. Witness the dramatic rise in labor force participation within the top income quintile (Figure 3): Over 60% of top-quintile individuals in the 65–74 age group are employed or seeking work, a 19-percentage-point increase in participation over the 15 years through 2013.2 Moreover, participation among top-income-quintile seniors 75 and older has more than doubled over the same period.4,/sup>
What about seniors’ late-life saving behavior? Consider the top two income quintiles, collectively accounting for about 80% of U.S. personal income. Based on 2014 data from the BLS’s Consumer Expenditure Survey, these high earners exhibit no decline in savings rates as they enter retirement (due in part to a strong bequest motive and high conservatism). In Figure 4, note how high and consistent these top earners’ savings rates remain even in their late 60s and 70s.
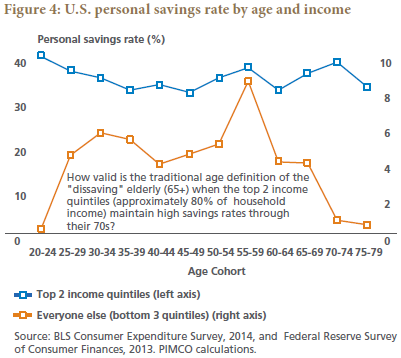
(Aside: We find it curious that savings rates, based on the BLS’s Consumer Expenditure Survey, do not become negative for lower-income-quintile seniors even in their late 70s. We suspect that other data sources may show a negative savings rate for these elderly groups, likely due to methodological differences in data collection. Our focus here, however, is on age-related trends in saving behavior rather than savings rates themselves.)
To recap: The most impactful seniors are working (and saving) later in life as functional age and the duration of retirement both increase.3 Therefore, our preferred measure of the demographic support for saving is a dynamic, not static, ratio that accounts for the trend toward longer working lives. Let’s revisit our Peak Savers versus Elderly ratio from Figure 2. In decades past, age 64 may well have been the sensible upper bound for the Peak Saver group. But what about the coming decades? In Figure 5, we have added a dynamic ratio (red line) that assumes seniors work roughly five years later in life in 2050 than they did in 2000. In other words, our age definition of “Peak Saver” evolves dynamically from 35–64 in 2000 to 35–69 by 2050, and consequently our definition of “Elderly” evolves dynamically from 65+ to 70+ over the same period. [ii]
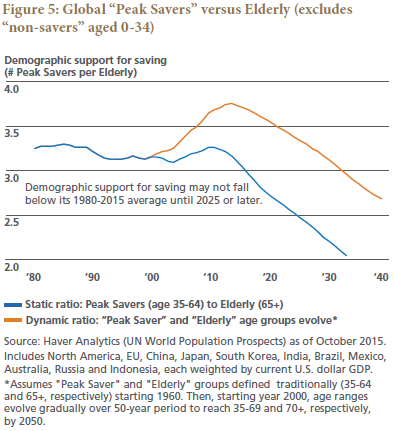
What a different picture the dynamic ratio paints! It suggests that demographic support for saving could well be as strong a decade from now as it has been in recent decades – and illustrates the extent to which traditional static ratios may be flawed.
We concede that our dynamic ratio forecast is only a guess as to what the future may look like if current trends persist. But there is some method to the madness. For example, the reason we start to phase the 65- to 69-year-olds into our Peak Saver group specifically in 2000 is that senior labor force participation began to rise rapidly in that year (after two stagnant decades). Our five-years-later-in-life-by-2050 employment assumption is slightly more arbitrary, but reasonable given that, globally, the largest increases in retirement age likely lie ahead of us. And our dynamic ratio does not account for the rising share of seniors 70+ who remain working, introducing an element of conservatism to our assumptions. So while our dynamic ratio embeds some simplifying assumptions, to be more scientific risks missing the forest for the trees. Almost regardless of the assumptions used, if you define a dependency ratio dynamically – based even loosely on observable trends – you are likely to paint a very different (and more accurate) picture of the future than you will paint using a static ratio.
What about the rest of the world? It appears we’ve made an argument about global demographics supported mainly with U.S. data. However, publicly available data for other economically significant regions does not permit as granular an analysis as we have shown for the U.S. We do have reason to believe similar trends are occurring outside the U.S.: Elderly labor force participation is rising in Europe, the UK and Japan, and some countries – including China – are contemplating raising the retirement age. In Japan, whose demographic cliff materialized many years ago, senior labor force participation has been trending higher, and as a result the labor force shrank only about 0.8% over the past decade even as the “working-age population” (aged 15 to 64) fell almost 9%. Patterns like this one are likely to repeat in other aging countries as societies adapt to meet their demographic challenges.
Bottom line: The people who move the needle most in saving demand, the highest earners, are the people working and saving later in life. This trend should be a tailwind for saving demand in the years to come that will push the global demographic cliff at least a decade into the future – and support a low global neutral interest rate, per the savings-investment equilibrium. 70 is the new 65!
U.S. household (demographic) demand for fixed income assets: a decade-long tailwind for bonds
We’ve just argued that demographics should help keep the global neutral rate low over the coming decade – which means that market yields in the U.S. should have a low “anchor.” But waves of baby boomers are retiring (albeit, as we have argued above, increasingly later), and many will eventually draw down (i.e., sell) their financial asset holdings to fund late-life consumption. Are we fast approaching the point when boomer drawdowns create selling pressure in fixed income markets that pushes interest rates higher? Or might U.S. aging (boomers included) actually bolster the (net) demand for bonds and help maintain a low ceiling for market yields?
Consider two key observations.
• First, as we should expect, investors generally de-risk away from equities and toward fixed income with age – most aggressively once they reach their 60s (and beyond).5
• Second, individual asset accumulation and drawdown patterns vary significantly by income level. In the U.S., individuals in the lowest income quintile tend to sell their limited financial assets beginning in their 50s and completely exhaust their assets by, or before, death (relying on social assistance to meet their basic needs in life’s latest stages). Middle-income individuals tend to draw down financial assets beginning in their 60s but not at a rate that would deplete their assets before death. Individuals in the highest income quintile, however, are shown to have rising financial asset balances until roughly age 80 (after which they decline only very gradually). In other words, for top-income-quintile individuals, portfolio drawdowns don’t tend to begin until roughly age 80 (an important point). The highest earners have historically been able to fund retirement consumption from income (generally employment income, investment portfolio income and annuitized income), “leaving their financial assets virtually untouched.”6 Here’s the key: Top-income-quintile households own over 80% of U.S. household financial assets. Consider how significantly this group’s future asset accumulation and drawdown profile will impact financial markets!
Back to our question about whether U.S. demographics will be a headwind or tailwind for bond flows in the years ahead. For starters, we assess when (demographics-driven) bond buying might peak relative to bond selling. We define “Bond Buyers” as individuals aged 60–74 and “Bond Sellers” as individuals 80 and older. These age definitions are somewhat arbitrary, but they’re based on the two previously introduced empirical observations about households in the top quintile of the U.S. income distribution (which hold over 80% of U.S. household financial assets):
• Bond buying tends to peak during individuals’ 60s and early 70s (aggressive de-risking);
• Bond selling tends to peak in the years after age 80 (as individuals sell down their financial assets to fund consumption in retirement).
Figure 6 shows the ratio of Bond Buyers to Bond Sellers, which we use to gauge when net demographic buying demand might theoretically peak. On this metric, U.S. demographic demand for bonds should continue to rise in the next five years or so before peaking and may still be as strong in 2025 as it is today. (Our age definitions are based on patterns observed among U.S. households, so we focus primarily on the blue U.S. line in the figure. We include a global version of the Buyers versus Sellers ratio as well – the green line – which reveals an even later potential peak in global demographic demand for bonds.7
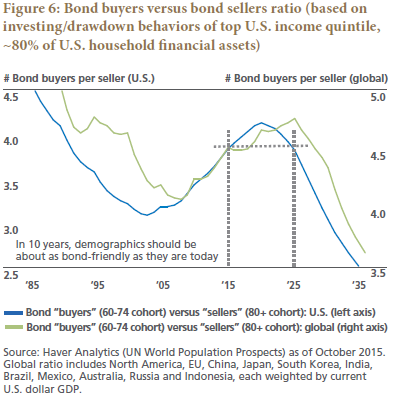
Our interpretation of this Buyers versus Sellers ratio assumes that each buyer exerts about the same influence on markets as each seller, an assumption that may be conservative given high-earning sellers draw down their portfolios only very gradually, whereas buyers likely will be de-risking aggressively in their 60s and early 70s. We “stress test” this assumption and result with scenario analysis in the Appendix.
Next, we explore the demographics of U.S. financial asset ownership at a very high level. Figure 7 shows household financial asset holdings by both age and income.8
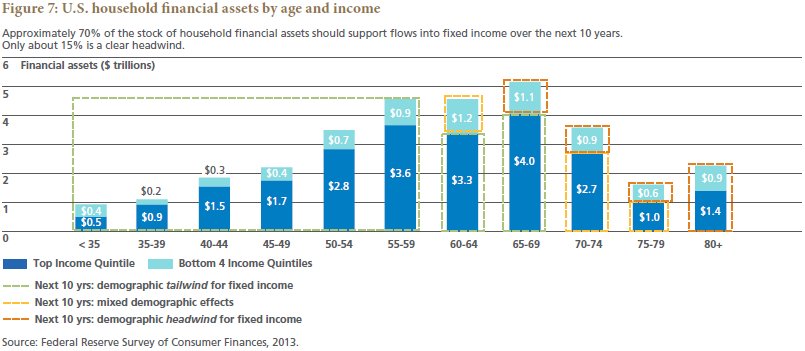
The lion’s share of the $31 trillion in U.S. household financial assets9 ($21 trillion, or about 70%) is held within – or over the next 10 years will be held within – age cohorts that typically need to grow their fixed income allocation. This $21 trillion, outlined in green in Figure 7, is expected to remain in an accumulation or de-risking phase and won’t enter a drawdown phase within the next decade (based on the age-related asset drawdown patterns we described earlier). This $21 trillion will likely be a demographic tailwind for bonds over the next decade (especially for municipal bonds given high earners’ need for tax-free income). Conversely, only about $5 trillion (approximately 15%) of household financial assets seems likely to be a headwind for bonds during this period (outlined in red).
One caveat: Many factors other than demographics influence investors’ asset allocation decisions – among them changes in valuations, evolving expectations about future asset returns, individual risk preferences, U.S. investor preference for domestic versus foreign assets, foreign investor preference for U.S. assets, and market disruptions that may trigger significant portfolio rebalancing. Our analysis here focuses only on demographic effects, holding all else equal.
Now let’s go a level deeper. In the Appendix we model the potential demographics-related asset flows we might see over time from the gradual de-risking and drawdown of household financial assets. We analyze 10 unique scenarios in order to test a range of assumptions. Our “baseline” scenario reflects a set of assumptions about de-risking behavior and asset decumulation that we think is realistic (and possibly conservative) based on historical patterns. Our modeling suggests that U.S. demographics-driven fixed income inflows are likely to be almost as strong 10 years from now as we project them to be today – and that demographics may not be a material headwind for bonds until the 2030s. How can we explain these conclusions? In our analysis, for at least the next decade, de-risking flows and rebalancing flows into fixed income more than compensate for seniors’ portfolio drawdowns. In stress testing our baseline assumptions we found it hard to come up with a plausible scenario in which U.S. demographics become a fixed income headwind within 10 years. Yet we found it easy to imagine realistic scenarios in which demographic demand for bonds remains robust for the next 15 years or more. Consider as an example the high-earning elderly, for whom longevity risk is rising rapidly as life-extending medical technologies proliferate. High earners, historically, have been overly cautious in recalibrating their spending to meet anticipated future needs – a finding that could warrant an even more gradual asset-drawdown trajectory for this next generation of retirees than we have modeled based on historical experience.
A brief aside: Our focus here has been U.S. demographics and, implicitly, U.S. fixed income. However, U.S. demographics are likely to influence global fixed income markets given U.S. households account for over 40% of global household financial assets. For context, Western Europe and Asia each account for about 25%.10
Finally, a quick note on changes in the composition of household retirement savings. The shift from defined benefit (DB) to defined contribution (DC) plans in the U.S. persists, and in our estimation U.S. DB plans hold a lower allocation to bonds than a market-average glide path suggests is optimal for DC participants.11 In aggregate, therefore, the continued shift toward DC may represent an additional tailwind for bonds in the coming years.
Bottom line on U.S. aging and the demand for bonds: Persistent demographic support for fixed income should, all else equal, drive net flows into bonds and help maintain low yields over the next decade.
‘Speed read’ and key conclusions
Some financial market observers believe in the following dramatic scenario:
• We’ve just gone over a demographic cliff; globally, the ratio of high-saving adult workers to dissaving elderly is now declining. This demographic reversal will erode the demand for saving.
• The global savings glut will reverse as the demand for saving falls, pushing the global neutral interest rate higher.
• Baby boomers in the U.S. will compound the problem as they sell their financial assets (including bonds) to fund retirement consumption, driving U.S. fixed income yields higher.
In this note, we challenge traditional thinking about the timing of the feared “demographic cliff.” A demographics-induced structural rise in U.S. interest rates remains at least a decade away:
1. Global demand for saving will remain robust, supporting a low global neutral interest rate (the “anchor” for U.S. fixed income yields):
• Traditional dependency ratios – which use fixed, static age definitions – are flawed because they fail to account for how the world is changing.
• U.S. elderly, especially the highest earners, are working and saving later in life. High earners matter a lot because they drive the lion’s share of global saving. 70 is the new 65.
• Similar trends can be observed in economically significant economies outside the U.S.
• We argue for a dynamic, not static, ratio of mature adults to elderly that does account for how working and saving behaviors are changing. Our dynamic ratio suggests that demographic support for saving may be as strong over the next decade as it has been over the past several. Possibly stronger.
• Strong saving demand should support a low global neutral interest rate in the coming years – and should continue fueling the global savings glut.
2. In financial markets, strong U.S. demographic demand for fixed income assets should – all else equal – help maintain low U.S. bond yields over the next decade:
• The lion’s share of U.S. household financial assets is held within age cohorts that will need to grow their fixed income allocation over the next ten years.
• Top-income-quintile households own over 80% of these assets, and high earners sell financial assets only very gradually in retirement to fund consumption.
• For another decade or more, demographics should remain a net contributor to fixed income flows, as high earners’ de-risking into bonds should dominate bond outflows due to portfolio drawdowns.
Combine a low global neutral interest rate and strong domestic demand for bonds, and what do you get? Lower rates for longer in the U.S.
The authors would like to thank PIMCO colleague Jim Moore for his contributions.
1. PIMCO Viewpoint “What’s Your Number at the Zero Bound”, by Dr. James Moore, 2012.
2. 2013 represents most current data available.
3. Our argument would be even stronger if we could show that the personal savings rate among high-earning seniors in their late 60s and early 70s has been increasing over time (parallel to the rise in labor force participation). However, the BLS has advised us that a comparison between 2014 data and prior-year data may be misleading due to recent changes in survey methodology.
4. From 2000 to 2050, our dynamic ratio – mechanically – is a weighted average of two individual static ratios (35–64 versus 65+ and, separately, 35–69 versus 70+); the weights change each year to reflect our assumption about rising longevity.
5. See, for instance, “The Impact of Demographic Shifts on Financial Markets” (McKinsey Global Institute, 2012).
6. “How Seniors Change Their Asset Holdings During Retirement” (Smith et al, 2009).
7. Validity of global Buyers versus Sellers Ratio depends on the extent to which asset accumulation-drawdown patterns among the high-earning elderly outside the U.S. mirror the patterns observed among U.S. elderly. We have not explored this question empirically and include the global ratio only for interest and context.
8. See Appendix for a technical note on our choice of the Federal Reserve’s Survey of Consumer Finances for U.S. household financial asset detail.
9. U.S. household financial assets, as depicted in the Federal Reserve’s 2013 Survey of Consumer Finances, total $31 trillion across all age groups.
10. Source: Allianz Global Wealth Report, 2015.
11. For color on U.S. DB pension plan asset allocations, see, for example, the OECD’s “Pension Markets in Focus” (2015) and Towers Watson’s “2014 Asset Allocations in Fortune 1000 Pension Plans” (2015).
12. Source: NextCapital.
13. See “Demographic Changes, Financial Markets, and the Economy” (Arnott and Chaves / CFA Institute, 2012).
14. For simplicity, we assume that anyone who dies younger than age 65 bequeaths assets to a spouse of comparable age (i.e., no change in asset allocation) while those who die at or after age 65 bequeath assets to someone (presumably children) 30 years younger (i.e., a generation earlier in risk tolerance). We recognize that not every elderly person bequeaths assets to a younger heir; some assets are passed on to charitable organizations and friends or other family members of comparable age, for instance. We assume, arbitrarily, that 50% of financial assets are passed to younger heirs. Our general results are not particularly sensitive to changes in these assumptions.
Matthew Tracey is account manager at PIMCO's Financial Institutions Group.
Joachim Fels is PIMCO's global economic advisor.