


But we ask: Is it sensible to define the Peak Saver and Elderly groups by the same static age ranges over long periods of time? Put differently: Might working and saving behavior evolve over time, warranting a dynamically modified dependency ratio? Seniors’ ability to work (and save) later in life should continue to rise; in our increasingly services-based “knowledge economy,” jobs are becoming less physically demanding and often require more experience, while advances in health technology boost functional age in life’s later stages. Seniors’ willingness (and incentives) to work longer also should rise along with their ability.
True, the retirement age, globally, has not kept pace with rising longevity. But policymakers are slowly catching on. In the U.S., the Social Security full-benefit retirement age is increasing to 67 and will go higher still – a government incentive telling people to stay in the workforce. Meanwhile, years of low interest rates have left impending retirees playing catch-up in retirement saving. More generally, around the world, longer lives must ultimately be supported by longer working lives. Anything less will prove unsustainable. Our colleague Jim Moore summed up the state of affairs (in the U.S.) in a PIMCO Viewpoint from 2012: “Work a little longer. Save a little more. Get by with a little less.1
We think this insight applies abroad as well. In fact, global trends already underway support our argument that people will work later and later in life. In many economically important geographies – notably the U.S., eurozone, UK and Japan – senior (age 65+) labor force participation has been trending higher. And China is contemplating steadily raising its retirement age in the coming years.
However, what matters most for global saving demand are those who earn the most income. Consider the U.S. as an example. Top-income-quintile households control nearly two-thirds of U.S. household income, three-quarters of household wealth and more than 80% of household financial assets. Apart from the major social ramifications of wide (and widening) income and wealth inequality, the implications for aggregate saving are critical: Rather obviously, high earners’ working and saving behavior has an outsized effect on global saving in dollar terms. If the highest earners are working (and saving) later in life, we should pay attention. Witness the dramatic rise in labor force participation within the top income quintile (Figure 3): Over 60% of top-quintile individuals in the 65–74 age group are employed or seeking work, a 19-percentage-point increase in participation over the 15 years through 2013.2 Moreover, participation among top-income-quintile seniors 75 and older has more than doubled over the same period.4,/sup>
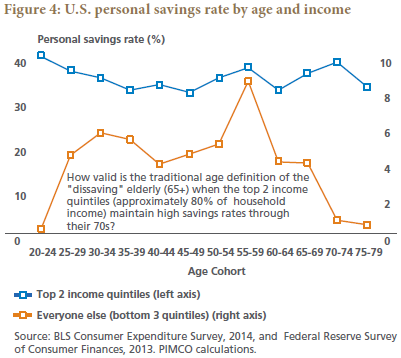
What about seniors’ late-life saving behavior? Consider the top two income quintiles, collectively accounting for about 80% of U.S. personal income. Based on 2014 data from the BLS’s Consumer Expenditure Survey, these high earners exhibit no decline in savings rates as they enter retirement (due in part to a strong bequest motive and high conservatism). In Figure 4, note how high and consistent these top earners’ savings rates remain even in their late 60s and 70s.
(Aside: We find it curious that savings rates, based on the BLS’s Consumer Expenditure Survey, do not become negative for lower-income-quintile seniors even in their late 70s. We suspect that other data sources may show a negative savings rate for these elderly groups, likely due to methodological differences in data collection. Our focus here, however, is on age-related trends in saving behavior rather than savings rates themselves.)
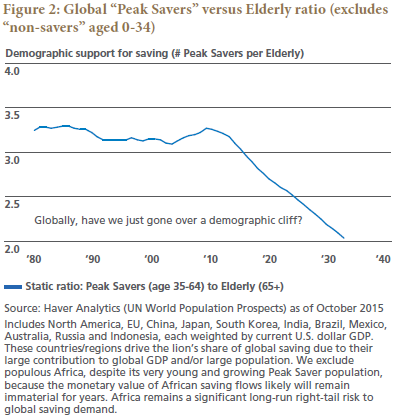
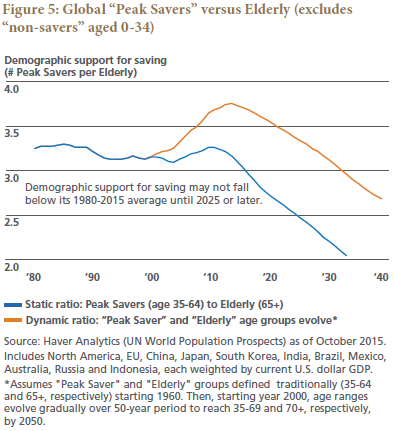
To recap: The most impactful seniors are working (and saving) later in life as functional age and the duration of retirement both increase.3 Therefore, our preferred measure of the demographic support for saving is a dynamic, not static, ratio that accounts for the trend toward longer working lives. Let’s revisit our Peak Savers versus Elderly ratio from Figure 2. In decades past, age 64 may well have been the sensible upper bound for the Peak Saver group. But what about the coming decades? In Figure 5, we have added a dynamic ratio (red line) that assumes seniors work roughly five years later in life in 2050 than they did in 2000. In other words, our age definition of “Peak Saver” evolves dynamically from 35–64 in 2000 to 35–69 by 2050, and consequently our definition of “Elderly” evolves dynamically from 65+ to 70+ over the same period. [ii]
70 Is The New 65
February 19, 2016
« Previous Article
| Next Article »
Login in order to post a comment