


Key Points
• August has been a “boring” month, with low volatility and volume; but that’s nothing new this year.
• History shows similarly subdued periods tend to be followed by a lift in volatility, and some weakness in returns.
• Fed policy will likely drive much of any additional pickup in volatility.
As most readers know, I always use rock song titles for my reports; although I don’t always weigh in on the why behind my choices. Sometimes the titles just fit perfectly. As I was writing this report, I thought about Florence and the Machine’s “Dog Days Are Over” but alas, I used that title a year ago. My choice of Kid Rock’s “All Summer Long” was perhaps a less-perfect fit, but I really love that song—and don’t hear it enough these days. It’s (my) perfect mashup of Lynyrd Skynyrd’s classic “Sweet Home Alabama” and Warren Zevon’s “Werewolves of London”. OK, I’ll move on to the topic at hand.
Dogs days of summer over?
In my August 15 report, I applauded the stock market for behaving while I was on vacation in Africa for two weeks. For all investors who took vacations so far this summer, the market has been on its best behavior, for which we are all grateful I’m sure. But are the “dog days” of summer coming to an end? We should push back on perhaps the natural tendency to become complacent in an environment of extremely low volatility (see chart below)—and trading volume. It’s unlikely to last; and there are some obvious potential triggers for at least a bit more excitement than what summer has brought to-date.
Source: FactSet, as of August 26, 2016.
So far in August, the S&P has remained in a very tight range, with both exceptionally low volume and volatility. And it’s not just August. Except for the first two months of this year, 2016 has seen below-average volume every month, according to data from SentimentTrader (ST). The chart below shows a 100-day average of the NYSE total volume relative to its 50-day average, which has been hovering below 95%. That means that over the past six months, an average day’s volume has been about 5% below its 50-day average, which is an extremely long time relative to history—especially with stock indexes trading near all-time highs.

Source: SentimenTrader, as of August 26, 2016.
Every time since 1940 that the S&P 500 closed at a multi-year high and the volume measure highlighted above was below 95%, the market struggled thereafter in the near-term. Over the next month, stocks were higher only four out of 12 times and averaged a negative return; and even three months out the risk/reward was still skewed to the downside.
Although August is typically a subdued month, it’s certainly in stark contrast to the market drama which unfolded in August of last year. ST has done several recent studies on the historical subsequent behavior of stocks following periods of extreme lows in volatility and volume. In particular, when occurrences like this were also accompanied by recent all-time market highs—as has been the case recently—shorter-term forward returns were relatively weak.
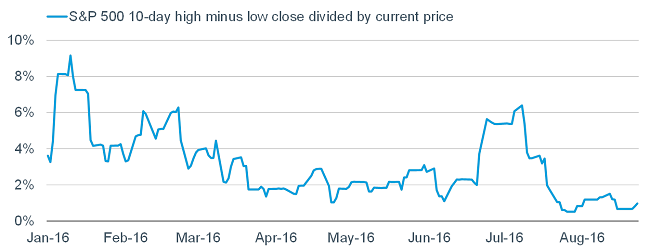
Twice so far in August, the S&P 500’s 10-day range dropped below 0.75%, one of the smallest in history (and as seen in the chart below). Similarly low readings historically were followed by negative near-term returns. A month later, the S&P 500 was negative more often than positive and sported a negative average return. It was consistent enough to suggest significance; and part of the reason is that even when it rallied, gains were small.

Source: SentimenTrader, as of August 26, 2016.
In terms of volatility, the risk of a meaningfully lower VIX over the next one-three months is well below that of a meaningfully higher one. Across most time frames from two weeks forward, the risk-reward was more than five-to-one. As ST notes, that doesn’t means stocks must retreat, but we shouldn’t get complacent about volatility likely remaining low.
Indeed, we have already begun to see a lift in volatility, and a rolling over in the market’s performance since August 23 (albeit down only 1% or so). Last week’s purported reasoning—which should continue to be a volatility factor—was Fed-related. Following Fed Chair Janet Yellen’s slightly more hawkish speech in Jackson Hole, WY last Friday, expectations for a rate hike at the FOMC’s September meeting are up to 42%; while they’ve jumped to 65% for December’s meeting.
Fed in focus
We would expect to see the September odds move as economic data comes in over the next few weeks. Most important is this Friday’s employment report. Fed Vice Chair Stan Fischer recently proclaimed that this report will make a huge difference in the September decision. We get it, but at times it seems as if the Fed has moved from being “data dependent” to “data point dependent.” That said, a strong report will likely further cement higher odds of a move in September.
Liz Ann Sonders is senior vice president, chief investment strategist at Charles Schwab & Co., Inc.