Q: The performance turn since late January has been dramatic. Is this a bounce, or the beginning of a sustained move?
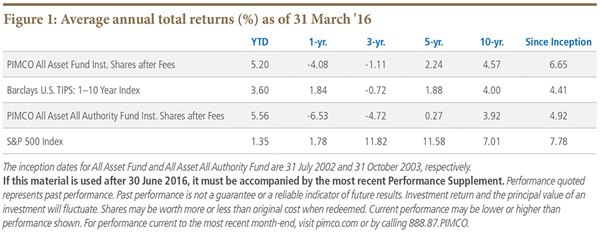
Arnott: Probably the latter. Since January’s lows through April 30th, our All Asset strategies returned over 14.5%, outpacing U.S. 60/40 (60% S&P 500 Index, 40% Barclays U.S. Aggregate Index) by more than 650 basis points. Is this a “dead cat’s bounce” or the start of a multi-year bull market? While it’s entirely possible that we will see a test of the lows, it’s also entirely possible that we will not test these lows. As we said in April’s Insights, we have neither the clairvoyant ability to time market turns, nor the skill to predict the catalysts for a bull market top or a bear market bottom. Instead of pointing to whether we’ve seen the bottom for the Third Pillar or the top for mainstream 60/40, we prefer to focus on long-term future rates of return.
While the last several weeks’ performance of the Third Pillar has been encouraging, it’s human nature to use the recent past as an anchor to form our expectations.1 Whether we are using the recent bounce to shape our optimism, or the grinding three-year bear market in Third Pillar assets to shape our pessimism, extrapolating from the past is profoundly unwise. It’s the single greatest source of investor error. For decades investors have made a mistake by setting unrealistic expectations based on inflated historical returns. So, when assessing the Third Pillar’s forward-looking prospects after a short-but-impressive run, we ask ourselves: Is the Third Pillar still trading at cheap levels relative to history? Or, has the recent strong performance put a dent on its forward-looking return prospects? Both are true.
The good news is even after the recent rebound, the Third Pillar is still trading at attractive levels relative to its history. It’s gone from cheap to a bit less cheap. The latest run doesn’t make Third Pillar markets expensive or vulnerable. Case in point: our models for long-term (10-year) real returns suggest that the recent outperformance in Third Pillar markets clipped their collective real return prospects by less than 0.2% since December.2 This is hardly a blow. We believe that Third Pillar asset classes today, especially relative to expensive mainstream U.S. stock and bond markets, are still bargains boasting attractive multi-year return prospects.

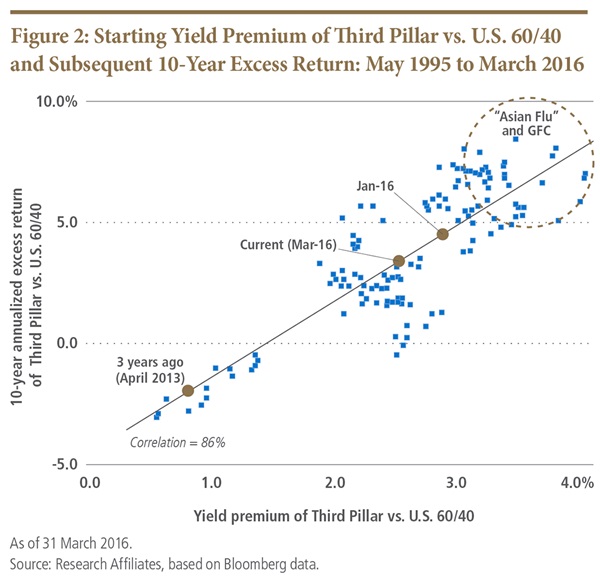
We’ve been on the record saying that we believe starting yields are a reliable predictor of future long-term returns. Over the last twenty years,3 the correlation between the starting yield premium of the Third Pillar over U.S. 60/40, and its corresponding 10-year excess return, is a remarkable 86%. Twenty years is a relatively short period of time in the history of capital markets, but results can be indicative. Given the short 20-year span, is this statistically significant? No. Is it economically powerful? Yes! Based on historical norms, the current yield premium suggests an excess potential return of 3% to 4% per annum, for Third Pillar relative to 60/40, compounding handily over the next ten years.4
Based on a casual glance at Figure 2, the current yield premium – while albeit lower than the start of this year – is far more robust than the levels seen since the start of a Third Pillar bear market three years ago, which was when we suggested these asset classes were not cheap and generally cautioned investors to tamp down their return expectations. Over the full span, outside of the Global Financial Crisis and the 1998 Asian Flu,5 the current yield premium remains in its highest historical quartile. Unsurprisingly, the rebound in the last two months relieved some of the tension in the proverbial “rubber band” of stored alpha from stretched spreads. But the rubber band is still taut.
If history is any guide, much of this performance will be front-end-loaded, delivering 5% to 8% annual excess returns, for the Third Pillar relative to U.S. 60/40 investing, over the coming three to five years. History suggests that the yield spread has a 93% likelihood of tightening (providing alpha larger than the yield spread) over the next five years.6 So, the five-year prospect of a continued rebound in the Third Pillar’s excess return over 60/40 remains compelling.
Naturally, most of us chase past performance. So, we saw immense inflows during the first half of 2013, and we’ve seen outflows in the face of recent bargains.
Isn’t it possible for the Third Pillar to see a test of the lows? Of course, but we think this is unlikely. Mean reversion is unreliably reliable: we cannot know when the pendulum will decisively swing back. The Third Pillar, having endured a rare and grueling three-year bear market, has been long overdue for a reversal. Only one other Third Pillar bear market (1995 to 1998) was longer and deeper than the current one. What followed after that rout? A portfolio of Third Pillar asset classes beat U.S. 60/40 investors in eleven of the next twelve years (including a run of nine consecutive wins). As with the late 1990s, a seven-year bull market in mainstream U.S. stocks, the second longest sustained bull market run over the last 200 years, is stretched and tired. So, the recent environment, barring many similarities to the late 1990’s, has set us up for the prospect of multiple years of outperformance. As with the late 1990s, the stretched rubber band of relative valuations might be all the catalyst we need to bring this to fruition.
Like us, you’ve chosen to invest in the All Asset strategies as a complement to diversify your investments in mainstream stocks and bonds, in an effort to protect against environments that can devastate mainstream holdings – such as rising inflation expectations – and to potentially exploit attractive relative valuation. We’ve had a wonderful three-month recovery in results. With Third Pillar markets still priced to offer impressive real return prospects, we want to be positioned for the possibility of a multi-year bull market, the early stages of which – like those in mainstream stocks and bonds – can be fast and impressive!

Q: Do you think inflation expectations will rise from today’s levels? Why is a change in inflation expectations important when considering the return prospects of the All Asset strategies?
Brightman: Yes. We anticipate rising inflation expectations. Before we delve into the reasons, let’s discuss why inflation expectations are important for the All Asset strategy. The relationship between the returns of the All Asset strategy and changes in break-even inflation is striking: the correlation is 80%! Over the life of the strategy, each 10 bps move in break-even inflation has been worth about 150 bps in Third Pillar returns and almost as much in AAF strategy returns. So, when expected inflation ticks higher, we expect our strategies to benefit, and vice versa.
These results are in line with our objectives. Since the launch of the All Asset strategy over 13 years ago, our mission has been to complement your mainstream investments by serving as a real-return-oriented diversifier. Our specific objectives are three-fold: 1) to improve long-term returns when mainstream assets offer low yields and low prospective returns; 2) to diversify exposure away from equity market risk; and 3) to favor assets positively correlated with inflation. With mainstream stocks and bonds yielding less than 2% today, any material increase in inflation can be devastating.
To provide context for our expectations of the future, we review the recent past. First, let’s look at wages, the most powerful domestic driver of long-term prices. The unemployment rate has dropped to 5.0%. This tightening of the labor market is creating wage pressure. The year-over-year percentage change in average hourly earnings, which bottomed at 1.6% in 2012, has now risen to 2.3%.
Next, consider the relationship between the U.S. Dollar, energy prices, and inflation expectations. The trade-weighted dollar soared by 25% over the past five years, peaking this January. Dollar appreciation lowers the cost of commodities and other imported goods. As oil prices collapsed from over $100 per barrel of WTI crude in 2014 to a low of $34 in January, inflation expectations fell to an historic low. The 10-year break-even inflation (BEI) hit bottom in February at 1.2%. The BEI has been lower only twice in history: following the Global Financial Crisis and the emerging markets’ debt and default crisis of 1998.
The trade weighted dollar peaked at the end of January and then, in March and April, dropped by 5%. At the same time, energy prices have rebounded. The price of a barrel of WTI has recovered to $46 by month-end April from its low of $34 in January. As the dollar peaked and energy prices have climbed, inflation expectations have recovered. Since its February low, BEI has risen by 0.5% to 1.7%, as of April 29th. Accompanying this recent rebound in inflation expectations is an impressive two-month performance run for our All Asset strategies.
With wages and energy costs both rising, inflation expectations have room to run higher. The Fed targets 2% for its preferred measure of inflation, the personal consumption expenditure (PCE) deflator within our national income and product accounts. The Fed has a long history of hitting its inflation target and we expect that they will continue to do so. The Fed’s 2% target for PCE inflation translates into a CPI inflation target of 2.4%. With the 10-year BEI for CPI at 1.7%, we expect inflation expectations to continue higher and possibly even overshoot.
1 We just issued a white paper and webinar, entitled “How Can Smart Beta Go Horribly Wrong?” that warns against this very mistake. We show that these recent trends have been helpful to their clients *only* because some of these strategies have become very expensive. http://www.researchaffiliates.com/Our%20Ideas/Insights/Fundamentals/Pages/442_How_Can_Smart_Beta_Go_Horribly_Wrong.aspx
2 The 10-year expected return of an equally-weighted blend of Third Pillar asset classes (Local EM bonds, high yield, U.S. TIPS, REITs, commodities, and EM equities) went from 3.73% as of December 31, 2015 to 3.58% as of March 31, 2016. These can be calculated on our Asset Allocation site: http://www.researchaffiliates.com/assetallocation/Pages/Portfolios.aspx
3 While we’d much rather use a longer time horizon for this analysis, the yields of most Third Pillar asset classes, which the exception of high yield and REITs, are unavailable prior to 1995.
4 This expected excess return does not take into account the value-add from continual rebalancing into active positioning, PIMCO funds’ alpha potential, and additional return achieved from leverage. Given this, we’d ascribe a higher expected excess return for the All Asset strategies, relative to U.S. 60/40.
5 We believe that the extreme parallels observed in both December 1998 and today are the drivers of future outperformance for the most hated asset classes as well as the drivers of disappointing return prospects for the most popular and comfortable markets. I discuss these parallels and implications in my recent Fundamentals, “Echoes of 1999: The Tech Bubble and the ‘Asian Flu’” http://www.researchaffiliates.com/Our%20Ideas/Insights/Fundamentals/Pages/543_Echoes_of_1999_The_Tech_Bubble_and_the_Asian_Flu.aspx
6 As we discussed in last month’s Insights, over the last 20 years when starting yields were stretched to 2.8% or more, spreads subsequently narrowed nearly 70% of the time over the next three years, and in 98% of all five-year spans.
Robert Arnott is the founder and chairman and Christopher Brightman is chief investment officer of Research Affiliates, a subadvisor to PIMCO.