


Here, you can see that when valuations roll over, with the change dropping below zero over a 10-month or 200-day period, the market itself typically falls shortly thereafter, as in 2008, 2000, 1995, and 1983. We see that kind of decline right now, so this is clearly an indicator of potential trouble.
Risk factor #3: Margin debt
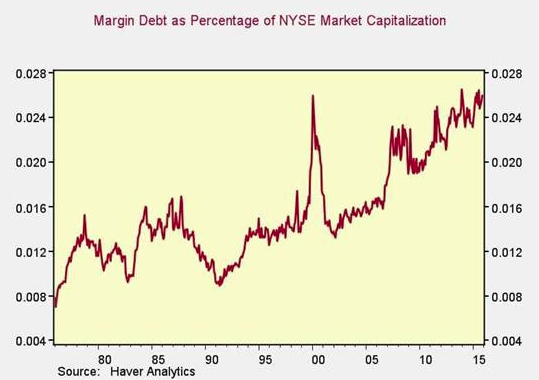
Another indicator of potential trouble is margin debt. In the chart below, we can see that, as a percentage of market capitalization, margin debt is very close to an all-time high, above the level of 2000. I think this is certainly an indicator of a potential deeper pullback.
Looking at the change over time, however, we don’t see the spike in debt that occurred in previous pullbacks—certainly not at the level of 2000 or 2007, or even 2011.
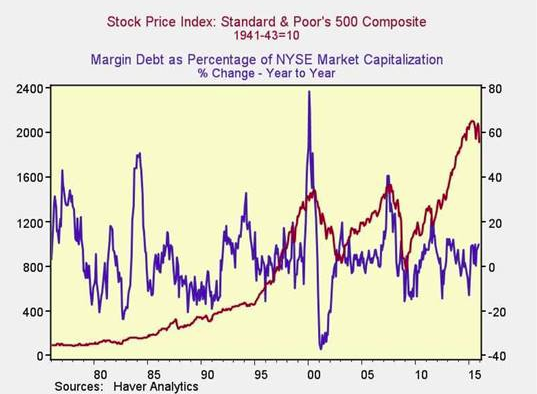
The absolute level of margin debt, then, is high, and so is the risk level, but the trigger isn’t being pulled just yet. Call this one half of a problem.
Risk factor #5: The Buffett indicator
Said to be favored by Warren Buffett, the final metric is the ratio of the value of all the companies in the market to the national economy as a whole.
