Key Points
- Household debt relative to income has plunged since the financial crisis.
- Debt servicing is easy courtesy of low interest rates.
- But preferences have changed and households much prefer savings over debt.
Much ink has been spilled on the post-debt supercycle era in which we sit, including by yours truly. In today’s report, I want to focus on households; perhaps because the U.S. public sector hasn’t yet begun talking honestly about its debt problem. However, households were “forced” into their deleveraging cycle when the financial crisis hit following the bursting of the housing bubble.
As you can see in the chart below, the ratio of household debt to disposable income in the United States fell dramatically in the aftermath of the financial crisis. Many argue that the trajectory of debt still needs to come down, and I agree; although debt has declined to near the pre-bubble (dotted) trendline which is good.
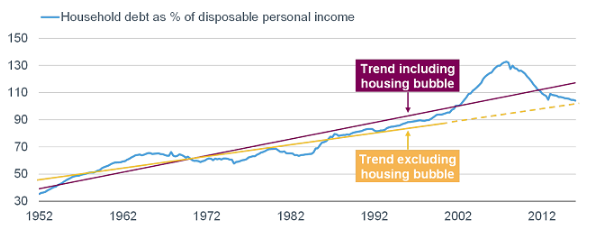
Source: FactSet, Federal Reserve, as of March 31, 2016. Purple and yellow lines represent trend lines.
However, as Bank Credit Analyst (BCA) opines, rightly so, debt levels are still very high by historical standards; and there is no reason to assume that the pre-crisis trend of an upward sloping debt-income ratio remained intact after 2008. The crisis could well have been the catalyst for the trend to become flat or even downward sloping. Alternatively, even if the ratio was back to trend, there could be an extended period where it falls below the trendline as a reaction to the earlier massive overshoot to the upside.
Debt growth picking up
According to the New York Federal Reserve, total household debt rose a slim 1.1% in this year’s first quarter to $12.25 trillion. That’s the seventh consecutive quarterly increase; with the largest increase in mortgage debt since before the last recession began. However, households’ disposable personal income growth has been rising faster, which means the ratio of debt to income is still falling.
Not surprisingly, the increases outside of mortgages were concentrated in auto and student loans; but credit card and home equity debts declined. The best news is that credit quality has continued to improve, with newly delinquent loans rising by the least since 2005. The percentage of loans at least 90 days delinquent did increase slightly for autos, but fell for mortgages, HELOCs, credit cards and even student loans. You can see the data highlighted above in the tables below.
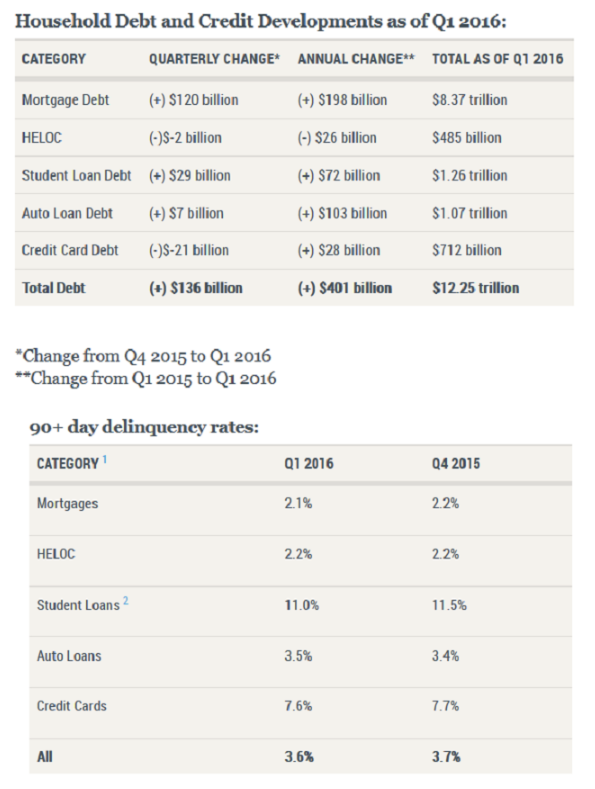
Source: Federal Reserve Bank of New York’s Quarterly Report on Household Debt and Credit (May 2016). Note 1: Delinquency rates are computed as the proportion of the total outstanding debt balance that is at least 90 days past due. Note 2: As explained in a previous report, delinquency rates for student loans are likely to understate effective delinquency rates because about half of these loans are currently in deferment, in grace periods or in forbearance and therefore temporarily not in the repayment cycle. This implies that among loans in the repayment cycle delinquency rates are roughly twice as high.
Post-Depression era redux?
An important consideration is whether the financial crisis unleashed a secular change in how the private sector thinks about debt and consumption. We may already have the answer, as you can see in the chart below. Households today have a notable bias toward savings over consumption and we believe this trend will be “sticky.”
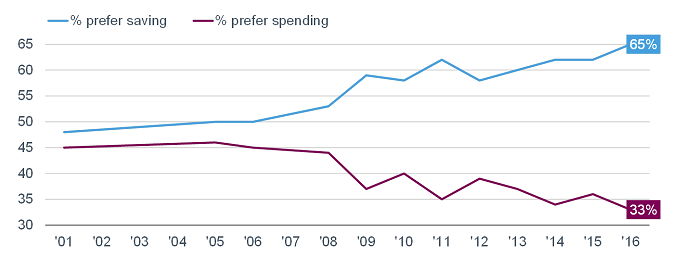
Source: Gallup Poll Social Series: Economy and Personal Finance. Based on results of Gallup Economy and Personal Finance poll conducted on April 6-10, 2016.
The trend is not dissimilar to what occurred in the 1930s and 1940s. According to BCA, nominal growth in U.S. private sector debt turned negative in 1931 and did not move sustainably into positive territory until 1947. In real (inflation-adjusted) terms, the level of private debt did not reach a new peak until the mid-1950s.
Debt service is “easy”
At present there is a positive double-whammy of lower debt levels and significantly lower debt servicing costs, courtesy of extremely low U.S. interest rates (which obviously won’t last if/when rates begin to rise). As you can see in the chart below, the debt service burden is in a very low zone, during which (historically) the economy has behaved well.
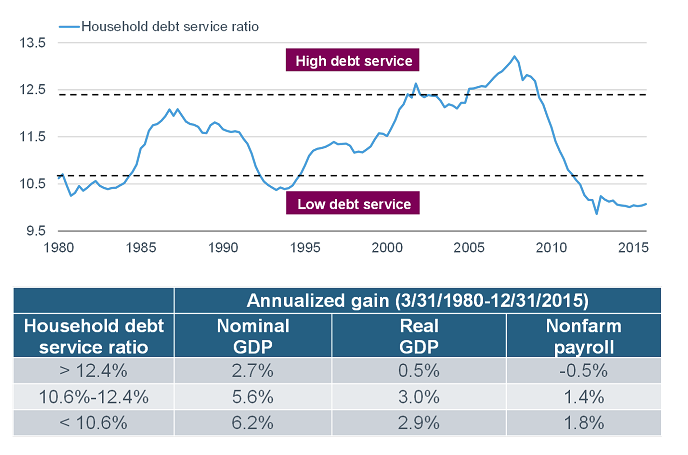
Source: FactSet, Federal Reserve, Ned Davis Research (NDR), Inc. (Further distribution prohibited without prior permission. Copyright 2016(c) Ned Davis Research, Inc. All rights reserved.), as of December 31, 2015. Household service debt ratio is an estimate of ratio of required debt payments to disposable personal income. Required minimum payments of interest and principal on outstanding mortgage and consumer debt are included.
In sum
The disposition of both borrowers and lenders regarding debt changed markedly during and in the aftermath of the financial crisis. And regardless of the efforts of the Federal Reserve, it’s unlikely a major new expansion of private sector debt is coming. The debt supercycle, lasting over three decades, allowed demand growth to exceed underlying income growth. That era has seemingly died and continued sluggish growth for the U.S. economy will likely continue to be a byproduct of that potential death.
Liz Ann Sonders is senior vice president, chief investment strategist at Charles Schwab & Co., Inc.