


The latest edition of the Federal Reserve’s (Fed) Beige Book was released Wednesday, September 7, 2016, and based on our analysis, continues to deliver a positive view of the current state of the U.S. economy. The Beige Book is a qualitative assessment of the U.S. economy and each of the 12 Fed districts individually. The report is prepared eight times per year, ahead of each of the eight Federal Open Market Committee (FOMC) meetings. The next FOMC meeting, the sixth of the year, is September 20–21, 2016. We believe the Beige Book is best interpreted by measuring how the descriptors change over time. The qualitative inputs for the June 2016 Beige Book were collected from mid-July through August 29, 2016. Thus, they captured Main Street’s reaction to:
§ A period of relative calm in U.S. and global financial markets
§ Rising oil production and modestly higher oil prices
§ A weaker dollar
§ Economic and inflation data reflecting the economic and market reaction to the surprising Brexit vote on June 23, 2016
SENTIMENT SNAPSHOT
We created our proprietary Beige Book Barometer (BBB) [Figure 1], to evaluate the sentiment behind the entire Beige Book collage of data. The BBB is a diffusion index measuring the number of times the word “strong” or its variations appear in the Beige Book less the number of times the word “weak“ or its variations appear. When the Beige Book Barometer is declining, it suggests that the economy is deteriorating. When the Beige Book Barometer is rising, it suggests that the economy is improving.
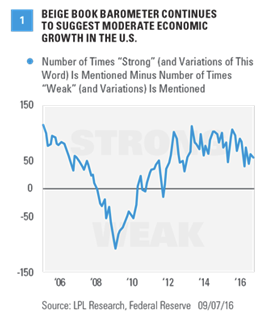
In September 2016, the barometer ticked down to +55 after the +61 reading in July 2016. At +55, the September 2016 reading is now back in the middle of the range it has been in since early 2012. All of the deterioration in the Beige Book versus July’s came in the three Fed districts in the nation’s oil patch (Minneapolis, Dallas, and Kansas City), despite a pickup in oil production in the past few months. Our Oil States Barometer (the barometer for the Fed districts that include the top oil-producing states) moved from +21 in July to just +7 in September, matching the +7 reading seen, on average, in the 8 Beige Books ending in June 2016, which coincided with the worst of the declines in oil production and prices. The +7 reading in September was even more disappointing given that the +21 reading in July put sentiment in these districts back to a level not seen since prior to the peak in oil prices in June 2014.
Now that the Fed has initiated its first rate hike cycle since 2006, FOMC members and market participants—who are trying to gauge what the Fed may do next—will be watching inflation closely. Each Beige Book provides an economy-wide assessment of wages and prices. The September 2016 Beige Book noted that “wage growth ranged from flat to strong across the Districts, but most reported that wage pressures remained fairly modest,” and “employment expanded at a moderate pace since the previous report.”

We monitor wage pressures via the data in Figure 2, which show the recent trend in the number of wage/inflation words in the Beige Book. We counted the number of times the words “wage,” “skilled,” “shortage,” “widespread,” and “rising” appeared in recent editions of the Beige Book. In September 2016, these words appeared 103 times, down from the 117 in June and the 109 in July 2016, but above the 2016 low of 100 in January. These words appeared, on average, 109 times per Beige Book in 2015. In all of 2014 — when deflation, not inflation, was a concern — those words appeared an average of just 98 times per Beige Book. So, after a brief drift back toward deflation worries in the January 2016 edition (100 mentions), the latest Beige Book shows a pickup in the number of inflation words. For reference, during 2011 – 13, also a period when heightened risk of deflation was evident, inflation words appeared 80 times per Beige Book on average.