The latest Beige Book suggests that the U.S. economy is still growing near its long-term trend, but that the drag from a stronger dollar and weaker energy prices, along with the slowdown in emerging market (EM) economies—most notably China, are still having a major impact on the manufacturing sector. In addition, our analysis of the Beige Book confirms that there has been some spillover of weakness from the energy and manufacturing sectors to other parts of the economy in recent months. Comments in the Beige Book also continue to indicate that some upward pressure on wages is beginning to emerge; but the wage pressures are not accelerating, which should keep the Federal Reserve (Fed) from raising interest rates aggressively this year.
The Beige Book is a qualitative assessment of the U.S. economy and each of the 12 Fed districts individually. We believe the Beige Book is best interpreted by measuring how the descriptors change over time. The latest edition of the Fed’s Beige Book was released Wednesday, March 2, 2016, ahead of the March 15–16, 2016 Federal Open Market Committee (FOMC) meeting, the second Fed policy meeting of 2016. The qualitative inputs for the March 2016 Beige Book were collected from early January 2016 through February 22, 2016. Thus, they captured Main Street’s reaction to:
§ A period of extreme volatility in U.S. and global financial markets
§ Heightened fears of a U.S. and global recession
§ Several 25%+ swings in oil prices
§ The announcement by the Organization of the Oil Exporting Countries (OPEC) of an oil production “freeze”
§ Another wave of capital spending cuts by U.S. energy-producing companies
§ Economic and inflation data for December 2015, January 2016, and February 2016 that were mixed at best for the U.S. and generally much weaker than expected overseas, especially in Europe
§ Increased discussion in the financial media about global deflation and negative interest rates
Sentiment Snapshot
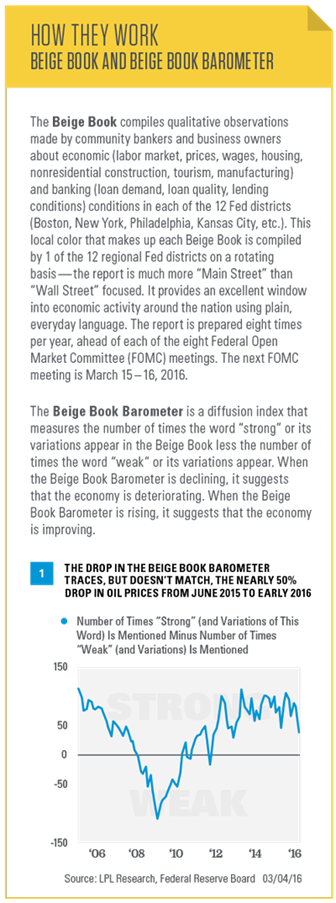
To evaluate the sentiment behind the entire Beige Book collage of data, we created our proprietary Beige Book Barometer (BBB) [Figure 1]. In March 2016, the barometer ticked down to just +39—the lowest reading since November 2012 (+30), which came in the aftermath of Superstorm Sandy’s impact on the East Coast. Notably, however, our BBB didn’t turn negative as it did during the summer and fall of 2011, amid the debt downgrade and debt ceiling debacle in the U.S. and fears of a sovereign default in the Eurozone that roiled global economies and financial markets. This suggests that the underlying economy in early 2016 is in much better shape than it was in late 2011, and thus better able to withstand the financial market turmoil.
At +39, the BBB remains well below its mid-2015 peak (+106 in July 2015), which followed a 40% bounce in oil prices from March to June 2015. The +106 reading in July 2015 was the highest reading since April 2013, and the second-highest reading in over 10 years. The downshift in the BBB from +106 in July 2015 to +39 in March 2016 traces, but doesn’t exactly match, the 50% drop in oil prices from June 2015 to early 2016. As we note in more detail below, however, most of the decline in the BBB since its 2015 peak has come in the non-energy-producing districts of the U.S, suggesting that there has been some spillover from lower oil prices to other parts of the economy and that the stronger dollar and economic weakness overseas are also acting as drags on the U.S. economy outside of the energy sector.
Watching Wages And Inflation
Now that the Fed has initiated its first rate hike cycle since 2006, FOMC members and market participants, who are trying to gauge what the Fed may do next, will be watching inflation closely. Each Beige Book provides an economy-wide assessment of wages and prices. The March 2016 Beige Book noted that “wages generally increased as most districts experienced slight to strong wage growth,” and that “labor market conditions continued to strengthen since the previous reporting period, with the majority of Districts reporting modest growth in the labor market.”
We monitor wage pressures via the data in Figure 2, which show the recent trend in the number of wage/inflation words in the Beige Book. We counted the number of times the words “wage,” “skilled,” “shortage,” “widespread,” and “rising” appeared in recent editions of the Beige Book. In March 2016, these words appeared 113 times, up from the 100 in January 2016, and above the 109 average seen in all 8 Beige Books in 2015. In all of 2014 — when deflation, not inflation, was a concern — those words appeared, on average, just 98 times per Beige Book; so after a brief drift back toward deflation worries in the January 2016, the latest edition shows a pickup in the number of inflation words. For reference, during 2011 – 13, also a period when heightened risk of deflation was evident, inflation words appeared, on average, 80 times per Beige Book.
Comments On Oil And Energy Spike Amid Volatile Oil Prices
Oil and energy received a total of 87 mentions in the March 2016 Beige Book, the highest reading since at least the start of 2014. The last Beige Book that even came close to seeing as many mentions of oil was the April 2015 Beige Book, with 83 mentions. For context, energy and oil had only around 40–45 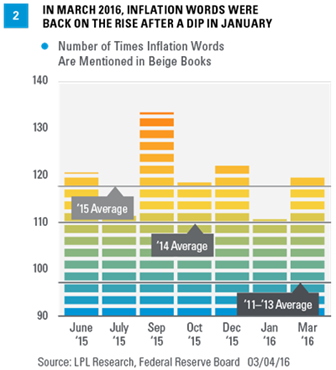
So far in 2016, oil prices have averaged around $32 per barrel, more than 33% below the average price in 2015 ($49 per barrel), which, in turn, was 48% below the 2014 average price of $92 per barrel.
To better gauge the impact of lower oil prices on the economy, we constructed a separate Beige Book Barometer [Figure 4] for the three Fed districts with the most energy-related economic activity (Minneapolis, Kansas City, and Dallas). During 2014, the Beige Book Barometer in the energy-related Fed districts averaged +18. In the 8 Beige Books released in 2015, the barometer in the energy-related districts was just +10, a clear deceleration in activity. In January 2016, the reading bounced back up to +18, but it cratered to -2 in the March 2016 Beige Book, reflecting the 20% drop in oil prices between mid-January 2016 and late February 2016 and the aforementioned announced capital expenditure cuts from U.S. energy producing companies. The -2 reading in March 2016 was the lowest since we began tracking this metric in early 2014.
As was the case in the Beige Books released in 2015 and in the January 2016 Beige Book, the March 2016 edition provided many comments from all 12 Fed districts about how lower fuel and energy prices were benefiting multiple industries. In short, comments on the impact of falling oil prices are consistent with our view that falling oil prices may be a net plus for the U.S. economy as a whole, but economies in certain states could see a significant impact from the additional slowdown in drilling activity that is likely to occur over the next six to nine months or so.
Fading Concerns/Rising Concerns
Uncertainty around fiscal policy and the Affordable Care Act has continued to fade as a concern; however, in some cases it has been replaced by 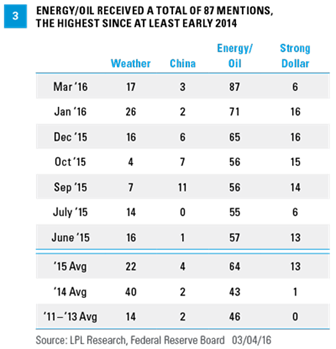
The concerns about a stronger dollar eased substantially in the latest Beige Book, as the value of the U.S. dollar versus the currencies of its major trading partners generally moved lower over the first few months of 2016. There were only 6 mentions of “strong dollar” in the 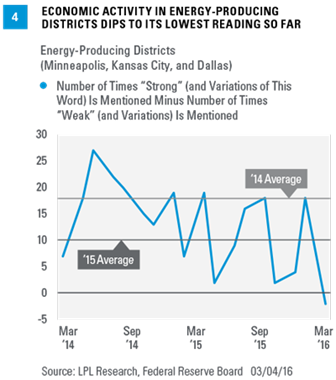
Although strong dollar concerns over the past 18 months have mainly come from manufacturers, retailers who cater to overseas customers and tourism contacts in areas that traditionally attract overseas tourists (New York, Florida, Nevada, and California) also cited the strong dollar as a drag on business in recent Beige Books. In the March 2016 Beige Book, contacts in the farm sector cited the strong dollar for weaker than anticipated exports of agricultural products.
Of the major transitory factors that impacted the economy and the Beige Book in early 2015 (dollar, oil, port strike, bad weather), only oil and the strong dollar remain as concerns, but there has clearly been some spillover from weaker oil into other parts of the economy. However, neither the dollar nor the other headlines has dampened optimism on the economy, which has picked up strength in the past year or so.
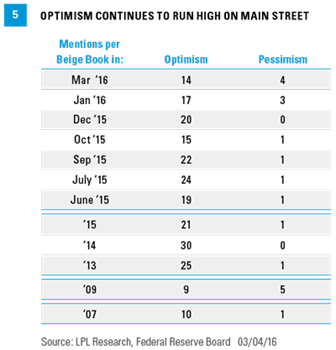
In the March 2016 Beige Book, the word “optimism” (or its related words) appeared 14 times, whereas the word “pessimism” appeared just 4 times [Figure 5]. In the 10 Beige Books released since early 2015, optimism appeared, on average, 22 times per Beige Book, while the word pessimism has appeared a total of just 12 times, with 8 of the 12 mentions coming in the Dallas and Kansas City districts, who were commenting on the outlook for the oil and gas sector.
As reassuring as it is to see that Main Street can remain optimistic despite the flow of bad news, the large number of optimistic comments in the Beige Book is not the start of a new trend: In the 8 Beige Books released in 2014, the word “optimism” appeared, on average, 30 times. In 2013, “optimism” appeared, on average, 25 times per Beige Book. In the 8 Beige Books released in 2009, during some of the worst of the financial crisis and Great Recession, the word “optimism” appeared, on average, just 9 times.
Concerns that today’s economic and market environment is similar to the onset of the Great Recession and the stock market peak in late 2007 also appear to be misplaced. In the 8 Beige Books released in 2007, the word “optimism” appeared, on average, just 10 times per edition — a far cry from the 30 times per edition in the 8 Beige Books released in all of 2014 and the 21 times per edition in 2015.
John Canally is chief economic strategist for LPL Financial.