The latest Beige Book suggests that the U.S. economy is still growing near its long-term trend, and that the drag from a stronger dollar and weaker energy prices is fading. However, oil production—which has continued to decline despite the run-up in oil prices from the mid-$20 per barrel range in January 2016 to near $50 today—is weighing on economic conditions in the energy-producing states. In addition, our analysis of the Beige Book confirms that there continues to be some spillover of weakness from the energy and manufacturing sectors to other parts of the economy. Comments in the Beige Book also continue to indicate that some upward pressure on wages is beginning to emerge; but the wage pressures are not accelerating quickly, which should keep the Federal Reserve (Fed) from raising interest rates aggressively this year.
Overall, the Beige Book described the economy as expanding at a “modest or moderate” pace in 7 of the 12 districts, about the same as in recent editions of the Beige Book. In general, optimism regarding the economic outlook far outweighed pessimism throughout the Beige Book, as it has for the past two years or so, but pessimism continues to run high in the energy-producing regions of the U.S.
The Beige Book is a qualitative assessment of the U.S. economy and each of the 12 Fed districts individually. We believe the Beige Book is best interpreted by measuring how the descriptors change over time. The latest edition of the Fed’s Beige Book was released Wednesday, June 1, 2016, ahead of the June 14–15Federal Open Market Committee (FOMC) meeting, the fourth Fed policy meeting of 2016. The qualitative inputs for the June 2016 Beige Book were collected from mid-April through May 23, 2016. Thus, they captured Main Street’s reaction to:
• A period of relative calm in U.S. and global financial markets
• Rising oil prices but falling oil production
• Falling odds of a summer Fed rate hike in early May that gave way to rising odds of a summer hike by late May, which sent the dollar on a round trip—weaker at first before rallying in the past month or so
• Economic and inflation data for February, March, April, and May 2016 that disappointed from February through early May and then began to exceed expectations over the rest of the month
• Increased discussion in the financial media about rising inflation and rising wages in the U.S.
Sentiment Snapshot
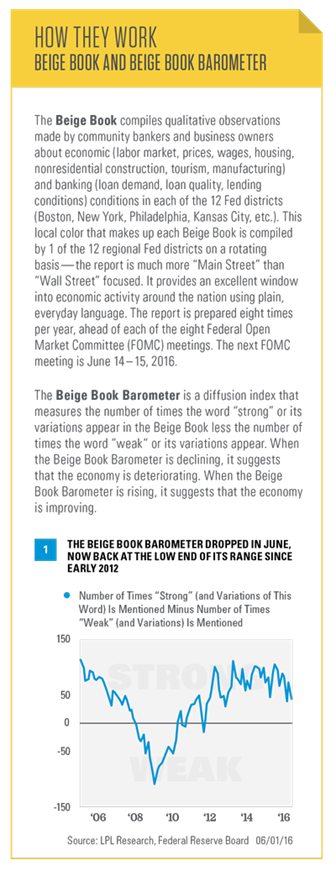
To evaluate the sentiment behind the entire Beige Book collage of data, we created our proprietary Beige Book Barometer (BBB) [Figure 1]. In June 2016, the barometer ticked down to just +44 after the +73 reading in April 2016. At +44, the June 2016 reading was still above the +39 reading in March 2016, but is now back at the low end of the range it has been in since early 2012.
Here in 2016, although oil prices have rebounded more than 80% off the February 2016 lows, oil production has continued to fall, and the continued weakness in the oil patch has weighed on the overall barometer.
However, most of the decline in the BBB since its 2015 peak has come in the non-energy-producing districts of the U.S., suggesting that there has been some spillover from lower oil prices and lower oil production to other parts of the economy.
Watching Wages And Inflation
Now that the Fed has initiated its first rate hike cycle since 2006, FOMC members and market participants, who are trying to gauge what the Fed may do next, will be watching inflation closely. Each Beige Book provides an economy-wide assessment of wages and prices. The June 2016 Beige Book noted that “wages grew modestly since the last report, with increases concentrated in areas of labor tightness,” and “employment grew modestly since the last report, but tight labor markets were widely noted in most districts.”
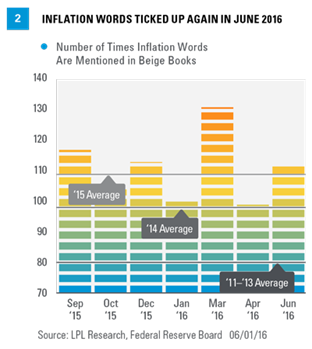
We monitor wage pressures via the data in Figure 2, which show the recent trend in the number of wage/inflation words in the Beige Book. We counted the number of times the words “wage,” “skilled,” “shortage,” “widespread,” and “rising” appeared in recent editions of the Beige Book. In June, these words appeared 117 times, up from the 104 in April and the 2016 low of 100 in January. These words appeared, on average, 109 times per Beige Book in 2015. In all of 2014 — when deflation, not inflation, was a concern — those words appeared an average of just 98 times per Beige Book; so, after a brief drift back toward deflation worries in the January 2016 edition (100 mentions), the latest Beige Book shows a pickup in the number of inflation words. For reference, during 2011 – 13, also a period when heightened risk of deflation was evident, inflation words appeared 80 times per Beige Book on average.
Comments On Oil And Energy Way Down
Oil and energy received a total of 87 mentions in the March 2016 Beige Book, the highest reading since at least the start of 2014; but just two Beige Books later, here in June, the mentions of oil and energy dropped to 53, the lowest since the start of 2014. This drop in mentions of oil and energy came as oil prices rose nearly 30% but oil production continued to decline. For context, energy and oil had only around 40–45 mentions per Beige Book in 2011–14 and 64 per Beige Book in 2015 [Figure 3]. So far in 2016, oil prices have averaged around $38 per barrel, more than 20% below the average price in 2015 ($49 per barrel), which, in turn, was 48% below the 2014 average price of $92 per barrel.
To better gauge the impact of lower oil prices on the economy, we constructed a separate Beige Book Barometer [Figure 4] for the three Fed districts with the most energy-related economic activity (Minneapolis, Kansas City, and Dallas). During 2014, the Beige Book Barometer in the energy-related Fed districts averaged +18. In the 8 Beige Books released in 2015, the barometer in the energy-related districts was just +10, a clear deceleration in activity. In January 2016, the reading bounced back up to +18, but it cratered to -2 in March, and bounced to +5 in April as oil rallied off the early 2016 lows. But in June, our barometer for oil-producing states plunged to an all-time low of -5, indicating that oil production may be a better indicator of sentiment in the oil patch than oil prices.

Fading Concerns/Rising Concerns

In the early part of 2016, uncertainty around fiscal policy and the Affordable Care Act continued to fade as concerns, but those concerns were replaced by fears of a stronger dollar, weaker energy prices, and uncertainty surrounding China. In the latest Beige Book, the concerns around the dollar, China, and oil have faded; in addition, there weren’t any mentions of concerns about the upcoming U.S. presidential election or the June 23, 2016, “Brexit” vote on whether the U.K. will remain in the European Union. China had just 3 mentions in the latest Beige Book, well below the 8 China mentions per Beige Book in the late summer and fall of 2015. China averaged only 2 mentions per Beige Book from 2011 – 14. As we noted in the Weekly Economic Commentary, “China Challenge,” while the Chinese economy has been slowing for more than five years, the news media and U.S. financial markets have only recently seemed to have taken note. In the latest Beige Book, 2 of the 3 China mentions were in a negative context.
The concerns about a stronger dollar eased substantially in the latest Beige Book, as the value of the U.S. dollar versus the currencies of its major trading partners generally moved lower over the first five months of 2016. There were only 2 mentions of “strong dollar” in June—down from the 15–20 mentions per Beige Book from September 2015 through January 2016. The 2 mentions in June were the fewest since the March 2015 report. To put these readings in context, the strong dollar was mentioned, on average, 13 times per Beige Book in 2015, but just once per Beige Book in 2014 and early 2015, and got virtually no mentions in 2011 – 13. Since the big run-up in the dollar between late 2014 and early 2015, the dollar has received, on average, 20 mentions per Beige Book. At current levels in the second quarter of 2016, the dollar is down 2–3% from a year ago, after rising 15–20% year over year throughout most of 2015. If it holds these levels, the dollar could be a modest tailwind for commodity prices, exports, manufacturing, and overseas earnings over the remainder of 2016.
Optimism Stil Rules
In the June 2016 Beige Book, the word “optimism” (or its related words) appeared 17 times, whereas the word “pessimism” appeared just 2 times [Figure 5]. In the 12 Beige Books released since early 2015, optimism appeared, on average, 19 times per Beige Book, while the word pessimism has appeared a total of just 15 times, with 11 of the 15 mentions coming in the Dallas and Kansas City districts, who were commenting on the outlook for the oil and gas sector.
As reassuring as it is to see that Main Street can remain optimistic despite the flow of bad news, the large number of optimistic comments in the Beige Book is not the start of a new trend: In the 8 Beige Books released in 2014, the word “optimism” appeared, on average, 30 times. In 2013, “optimism” appeared, on average, 25 times per Beige Book. In the 8 Beige Books released in 2009, during some of the worst of the financial crisis and Great Recession, the word “optimism” appeared, on average, just 9 times.
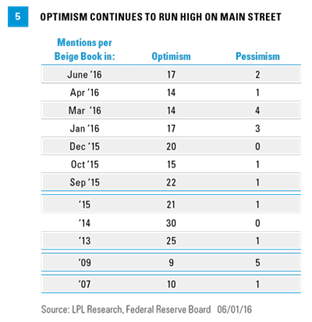
Concerns that today’s economic and market environment is similar to the onset of the Great Recession and the stock market peak in late 2007 also appear to be misplaced. In the 8 Beige Books released in 2007, the word “optimism” appeared, on average, just 10 times per edition — a far cry from the 30 times per edition in the 8 Beige Books released in all of 2014, the 21 times per edition in 2015 and the 16 per Beige Book so far in 2016.
John Canally is chief economic strategist for LPL Financial.