


To evaluate the sentiment behind the entire Beige Book collage of data, we created our proprietary Beige Book Barometer (BBB) [Figure 1]. In June 2016, the barometer ticked down to just +44 after the +73 reading in April 2016. At +44, the June 2016 reading was still above the +39 reading in March 2016, but is now back at the low end of the range it has been in since early 2012.
Here in 2016, although oil prices have rebounded more than 80% off the February 2016 lows, oil production has continued to fall, and the continued weakness in the oil patch has weighed on the overall barometer.
However, most of the decline in the BBB since its 2015 peak has come in the non-energy-producing districts of the U.S., suggesting that there has been some spillover from lower oil prices and lower oil production to other parts of the economy.
Watching Wages And Inflation
Now that the Fed has initiated its first rate hike cycle since 2006, FOMC members and market participants, who are trying to gauge what the Fed may do next, will be watching inflation closely. Each Beige Book provides an economy-wide assessment of wages and prices. The June 2016 Beige Book noted that “wages grew modestly since the last report, with increases concentrated in areas of labor tightness,” and “employment grew modestly since the last report, but tight labor markets were widely noted in most districts.”
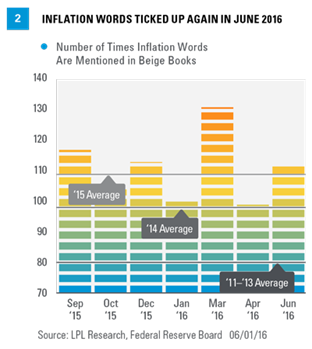
We monitor wage pressures via the data in Figure 2, which show the recent trend in the number of wage/inflation words in the Beige Book. We counted the number of times the words “wage,” “skilled,” “shortage,” “widespread,” and “rising” appeared in recent editions of the Beige Book. In June, these words appeared 117 times, up from the 104 in April and the 2016 low of 100 in January. These words appeared, on average, 109 times per Beige Book in 2015. In all of 2014 — when deflation, not inflation, was a concern — those words appeared an average of just 98 times per Beige Book; so, after a brief drift back toward deflation worries in the January 2016 edition (100 mentions), the latest Beige Book shows a pickup in the number of inflation words. For reference, during 2011 – 13, also a period when heightened risk of deflation was evident, inflation words appeared 80 times per Beige Book on average.
Comments On Oil And Energy Way Down
Oil and energy received a total of 87 mentions in the March 2016 Beige Book, the highest reading since at least the start of 2014; but just two Beige Books later, here in June, the mentions of oil and energy dropped to 53, the lowest since the start of 2014. This drop in mentions of oil and energy came as oil prices rose nearly 30% but oil production continued to decline. For context, energy and oil had only around 40–45 mentions per Beige Book in 2011–14 and 64 per Beige Book in 2015 [Figure 3]. So far in 2016, oil prices have averaged around $38 per barrel, more than 20% below the average price in 2015 ($49 per barrel), which, in turn, was 48% below the 2014 average price of $92 per barrel.
To better gauge the impact of lower oil prices on the economy, we constructed a separate Beige Book Barometer [Figure 4] for the three Fed districts with the most energy-related economic activity (Minneapolis, Kansas City, and Dallas). During 2014, the Beige Book Barometer in the energy-related Fed districts averaged +18. In the 8 Beige Books released in 2015, the barometer in the energy-related districts was just +10, a clear deceleration in activity. In January 2016, the reading bounced back up to +18, but it cratered to -2 in March, and bounced to +5 in April as oil rallied off the early 2016 lows. But in June, our barometer for oil-producing states plunged to an all-time low of -5, indicating that oil production may be a better indicator of sentiment in the oil patch than oil prices.

Fading Concerns/Rising Concerns
