


In 2008, many investors found that traditional approaches relying on diversification to reduce risk failed them. Portfolio management strategies which were generally considered sound faltered. The markets defied the tenets of covariance and diversification and many asset classes declined precipitously across the board. Conventional portfolio construction theory has held forth the notion that asset diversification reduces risk. We believe investors have misunderstood this, interpreting it to mean that diversification protects capital. While diversification can reduce total risk if the correlation among the portfolio assets is low, we feel the real problem is that in periods of market turmoil, the low correlations evaporate as many assets move down together. Therefore, just when you need the risk-reducing benefits of diversification the most, they actually disappear, and capital is lost rather than protected.
Managing Portfolios For Market Capture
The goal of each WBI strategy is to provide investors with wealth-building investment strategies that target an optimal blend of bear market capital preservation and bull market return. WBI’s responsive investment management process is designed to adjust portfolio allocations from being fully invested to maximize return, to raising cash to protect capital as risk increases. We believe that capital preservation in bear markets is far more important to achieving success than chasing the highest returns during bull markets.
Our observations about investor behavior in down-market cycles became the driving force behind the development of WBI’s powerful investment methodology. Each portfolio design starts by determining a risk and return profile that targets a down-market capture ratio of less than 100 percent when compared to a representative market index. We also target an up-market capture of as close to 100 percent as possible while continuously seeking to protect capital. The optimal blend of up-market and down-market capture depends on the portfolio investment objective.
For example, WBI’s Absolute Return Dividend Income Portfolio (DGI) seeks a down-market capture ratio of 50 percent with an up-market capture ratio of 70 percent to the S&P 500 Index. An additional portfolio design criteria is to limit cumulative down market losses, which for DGI is expressed as a maximum drawdown target of 20 percent. While this is a target and not a guarantee, we believe the DGI portfolio design targets provide investors with a pretty conservative loss profile when compared to the S&P 500 Index. Since DGI’s inception on June 30, 2003, investors experienced a net of fee maximum drawdown of 21.31 percent compared with 45.80 percent for the index. DGI also achieved a down-market capture ratio of 42 percent and an up-market capture ratio of 60 percent to the S&P 500 Index. The charts displayed are based on a net of fee calculation equaling gross of fee minus an assumed 1 percent WBI annual fee.
The benefits of developing an optimal blend of up-market and down-market performance can be very powerful over an investor’s lifetime. To illustrate the potential long-run capital and wealth-building benefits of WBI’s investment approach, we built a quantitative illustration to estimate how an investor may have fared going back to 1928. There is no guarantee that we would have been able to achieve the results illustrated, however they are based on the actual capture ratio we achieved since each portfolio’s performance composite inception.
The Long Run
How reasonable are the hypothetical results? We compared the 10-year performance periods of WBI’s actual monthly performance composite records, net of fees, versus the corresponding hypothetical results in Charts 2A and 2B.
 The world of investing has changed dramatically. Over the past decade, many investors have discovered that conventional passive growth stock approaches failed to meet their goals. Following a buy-and-hold approach, investors suffered losses of as much as 51 percent during the 2000 through 2013 period. We believe conventional portfolio theory regarding the benefits of diversification has been broadly misinterpreted to mean that market returns will bail you out, and so investors should not worry about short-term losses. But in reality, typical market losses like these can make it difficult for investors to fund their retirement sufficiently, and may cause them to outlive their stream of income.
We believe investment allocators need to develop a process to find managers who have demonstrated ability over time to protect capital from severe losses in bear markets while capturing good returns in bull markets. Such ability may be confirmed using capture ratio statistics. To meet the “acid-test,” investment approaches must work in both good and bad market cycles. We believe that today more than ever, investors need to develop better allocation and manager selection approaches to replace the risk benefits of diversification to improve their odds of building capital more consistently.
WBI offers four flagship strategies: Absolute Return (AR) Dividend Growth (DGP), AR Dividend Income (DGI), AR Balanced Plus (HIB), and AR Balanced (IBP). Chart 1 illustrates the hypothetical results of these strategies, estimated over the 85-year period January 1, 1928, through December 31, 2013. The results displayed in Chart 1 were developed by quantitatively back-testing the actual monthly performance composite records, net of fees, of WBI’s four flagship strategies currently representing approximately $2.6 billion of total assets under management in more than 10,000 separately managed accounts.
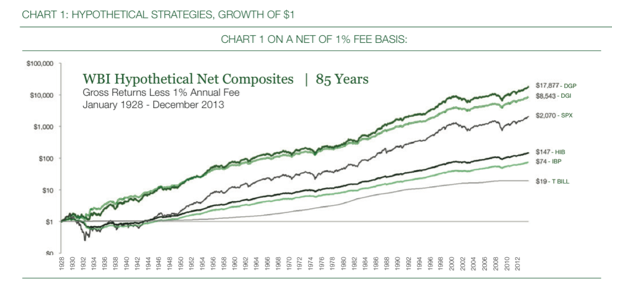
While chart 1 displays hypothetical rather than actual performance records, it is intended to illustrate the characteristics of strategies currently employed by WBI, had they been available over a long-term horizon covering a wide variety of economic and market cycles. Both of the equity strategies (DGI and DGP) significantly outperform the S&P 500 Index over the period, while both of the balanced strategies (HIB and IBP) significantly outperform fixed income as represented by the U.S. 3-month Treasury bill.
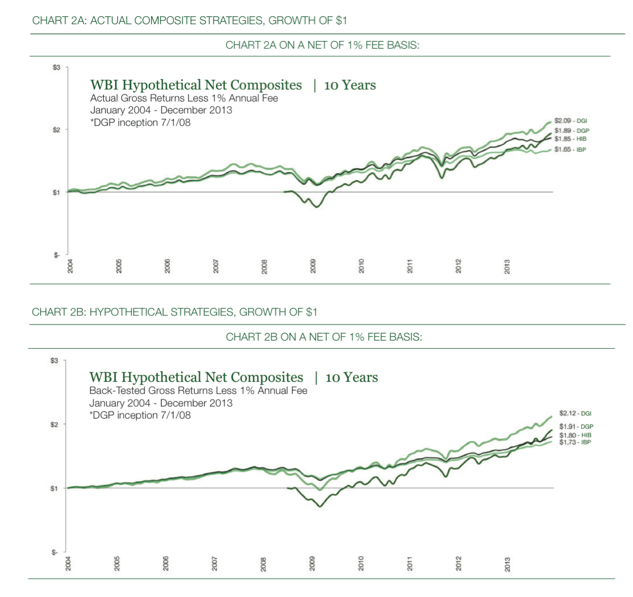
Chart 2A illustrates the 10-year historical performance records of the actual monthly performance composite records, net of fees, of WBI’s four flagship strategies, while Chart 2B displays the hypothetical back-tested results over the same period.
Benefits Of Optimizing Portfolio Capture Ratios
July 7, 2014
« Previous Article
| Next Article »
Login in order to post a comment