There are approximately 8,000 mutual fund strategies, 7,000 separate account strategies and nearly 2,000 ETFs. Unfortunately, a good portion of these strategies have and will continue to produce disappointing returns for investors. With many products and few good, long-term options, it’s important for investors to “do their homework” prior to making an investment. But, before doing more detailed work, the list of investment options will need to be trimmed. One way to trim the list is to utilize broad quantitative screens in third-party databases. These screens may include items such as manager tenure, fees or portfolio turnover. However, even after applying these broad screens, a significant number of products will remain. Unfortunately, the screens do not provide much in the way of useful information on managers either (particularly qualitative information, which we spend a disproportionate amount of time on). So, another way research teams may search through investment opportunities is by meeting with portfolio managers and representatives from asset management firms on a regular basis.
In my time as an investment analyst I have met with hundreds of firms. On the surface, every firm tends to have a compelling story and an attractive way to present their investment team and demonstrate their skill as a manager. However, as we all know, what lies beneath the surface can be the most telling. So, it’s important that an analyst determines what’s behind a manager’s seemingly attractive results, what differentiates them relative to competitors and most importantly, if they have a clearly defined investment process that has been (and will continue) to consistently deliver superior risk-adjusted returns to investors.
At this point, you may be thinking, “That’s great you meet with managers, but what’s next? What follow-up analysis do you conduct?” For the managers that grab our attention, we begin the next phase, what I believe is the fun part, digging into the background of the firm, investment team, investment process and analyze portfolio characteristics, historical holdings and performance, among many other factors. Rather than skip around to discuss other factors we analyze, I’ll build on the ideas I described in the last blog I wrote, “Danger of Point-in-Time Analysis,” which discusses the drawbacks of point-in-time performance analysis and the merits of using alternate methods to analyze results. Now I’ll take the discussion one step further to answer the next question, “Once you have the performance broken down the way you would like to see it, then what?”
The most effective way I can answer this question is to walk-through a real life example of a manager that “pitched” us their strategy during a meeting. For obvious reasons, I will not divulge the name of the manager or the strategy, but I will provide some general background, which includes:
· The manager and their team were hired by an asset management firm to run small- and small-/mid-cap value-oriented equity strategies.
· One of the key selling points the individuals focused on in our meeting was the manager’s excellent track record while managing a similar strategy at a previous firm.
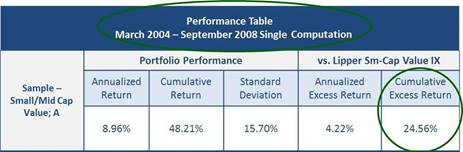
· The manager’s track record on the “strong performing” strategy stretched from March, 2004 through September, 2008.
Because the manager made a compelling case for investment (and because the strategy is in a capacity-constrained asset class), we took a closer look. One of the first items we looked at was the manager’s track record at their previous firm. As you can see in the table below, the manager had an excellent track record for the entire timeframe they managed the strategy. For instance, the manager’s strategy delivered a cumulative excess return of +24.56% over their Lipper peer group benchmark (circled in green). Most notably, the strategy outperformed their peers by a significant margin in 2007 (circled in green).
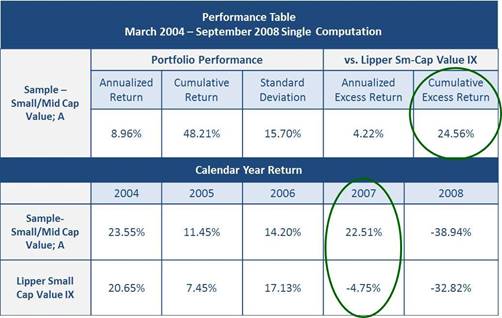
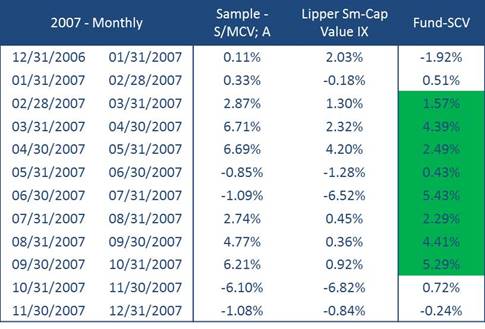
With the above data in hand, the next question becomes, “What happened in 2007?” As a starting point, we broke out performance of the strategy relative to their Lipper peer group benchmark into monthly periods. The monthly relative performance figures revealed most of the outperformance was over the middle eight months of 2007 (highlighted in green).
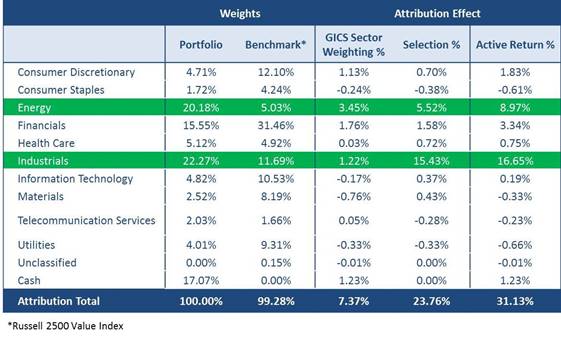
Now that we had the specific periods of out performance, we were able to dive deeper into those specific periods to determine what drove returns. Was it good stock selection across most sectors of the market? Or, was it a heavy emphasis in a few sectors of the market that significantly outpaced the broad market? This is where our next “tool” comes into play – attribution analysis. Attribution analysis isolates specific sectors, weights among those sectors and performance of individual stocks so we can determine what was responsible for a strategy’s under-, or out performance relative to a market index. What can be seen in the attribution table below is the strong results over the eight-month period noted above were primarily a function of concentrated sector bets along with good stock selection in two sectors of the market; energy and industrials.
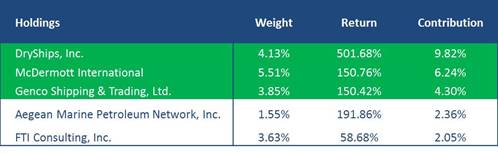
Once we had the data above, we were able to further isolate what was responsible for the strong performance in the energy and industrial sectors. What can be seen below is that three stocks contributed approximately 20% of the fund’s total performance over eight months. Furthermore, it can be seen that the performance of only five stocks over eight months explains the entire out performance relative to peers over a period of nearly five years!
The main takeaways from the performance and attribution analysis were:
· The strategy’s out performance was a function of only a handful of stocks in the portfolio.
· There was no history available to determine how the manager performs in down markets since the manager left their prior firm before the fourth quarter of 2008.
· Without having the down market history noted in the bullet point above, we do not know what the manager would have done with the “winning” stocks on the way down. Would they have sold the “big winners” before the market went down? Would they have sold them during the way down? Or, would they have held them the entire way down? Unfortunately, there is no way to get an answer to these questions outside of hearsay and speculation.
· Does the manager have skill at selecting stocks in other sectors/industries of the market, or was their out performance simply a function of one large industry bet? Was it truly based on bottom-up, fundamental work? Or, was it based on a top-down, macroeconomic driven theme? Without answers to the questions above, and without answers to other questions that surfaced during our analysis, we cannot be certain (or, at least not with a high-degree of confidence) that the manager’s investment process consistently yields good stock picks.
In this instance, there were too many questions and too few answers to recommend client assets be invested with the manager and in this strategy.
While this post was far from a complete synopsis of researching and choosing an investment opportunity, it should provide insight into the steps I believe are imperative to complete prior to selecting an investment manager. Not surprisingly, knowing what you’re actually investing in goes a long way to managing expectations and avoiding disappointment!
Charles J. Batchelor is director of investment research for Cleary Gull.