The Brexit will have some negative impact on corporate profits through a stronger U.S. dollar. But in the second quarter of 2016, the dollar should have a minimal impact on earnings despite the surge in the currency on Friday, June 24, 2016. The stronger dollar is putting some downward pressure on commodity prices, which will be a drag on energy and materials sector profits. We expect that tightening financial conditions, lower interest rates, and U.K. exposure will likely have some incremental negative impact on financial sector profits, which was reflected in that sector’s 5.4% drop on Friday, the worst among all S&P sectors.
The good news is most companies have minimal exposure to the U.K., and the U.S. dollar is little changed over the past year against the global basket of currencies that make up the U.S. Dollar Index. So although some companies may use the Brexit as an excuse for falling short of estimates, overall we would expect U.S. companies to surpass expectations for a mid-single-digit year-over-year decline (Thomson Reuters consensus estimates), which could help reassure some of the Brexit fears. Companies begin reporting in mid-July. Look for our second quarter 2016 earnings preview in the July 5, 2016 edition of the Weekly Market Commentary.
POTENTIAL MARKET IMPACT
Despite the uncertainty posed by the Brexit, we are sticking with our 2016 forecast for mid-single-digit S&P 500 total returns and ongoing volatility, as we wrote in our Outlook 2016 publication. As of early trading Monday morning, June 27, the S&P 500 is down about 2% year to date, and just 1% including dividends.
The Brexit’s likely limited economic and earnings impact is the primary reason for our optimism. The likelihood that the Federal Reserve (Fed) hikes just once this year, not twice as we had previously anticipated, is also supportive. We continue to expect corporate earnings to rebound solidly in the second half of 2016 despite the Brexit impact. Stock market valuations remain reasonable, especially considering low interest rate levels. There are some encouraging technical signs, as we discuss below. Finally, in looking back at other big down days following periods of relatively modest volatility,[1] stocks have generally fallen only marginally over the subsequent month and produced solid gains (median of 6%) over the subsequent three months.
But that does not mean we expect a smooth ride. Given the political uncertainty in Europe is likely to linger and other countries may follow the U.K., a correction (a 10% or more decline) is certainly possible. The summer is seasonally weak for stocks historically and the U.S. election still has the potential to cause volatility.
TECHNICAL ANALYSIS PERSPECTIVE
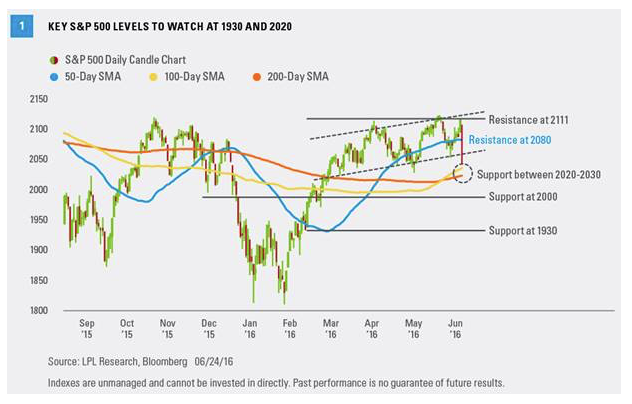
We asked our technical strategist David Tonaszuck to share his key technical support levels to watch for the S&P 500. The index’s daily price is in the process of breaking trend channel support at 2055. Below 2055, the next level of support is the area between 2020 (the 200-day simple moving average [SMA]) and 2030 (the 100-day SMA) [Figure 1]. A closing price below 2020 for five trading days increases the likelihood of a drop to the next support level at 1930, 9% below the all-time closing high on May 21, 2015.
For the optimists, the next bullish catalyst would be a closing price back above 2080 (the 50-day SMA), which would be an initial signal for a potentially aggressive buy on the dip opportunity.