The financial crisis has laid bare some of the folly of long-term financial planning. The notion that you can use past data on assets to create forward-looking plans that stretch out ten, 20 or 30 years is naïve.
When advisors make predictions about the returns on stocks, for instance, they are often looking back at data on returns, standard deviations and correlation coefficients going back to 1926. The conventional wisdom holds that the farther back in years the data goes, the better. But what the 2008 crisis taught us is that this method of considering possible bad outcomes is deficient.
Monte Carlo simulation in financial planning programs, for instance, uses historical returns of asset classes and their standard deviations to project possible future outcomes. In most planning apps, a lognormal or fat-tail distribution is used to better reflect the unlikely chance of a really big gain or loss in any given year. But it turns out that Monte Carlo simulations randomize returns and risk data too much to model the real world accurately. The math doesn't work. It fails to see that some economic conditions linger-that portfolios can perform very poorly or very well several years in a row.
Actual economic scenarios, in other words, instead of randomness, should thus become the basis of investment projections. Real-world historical data should form the building blocks of simulations.
This is not a new concept. And yet scenario planning has not caught on among advisors. The financial crisis, though, may have shown we must have it in our financial planning applications.
To make the case, I enlisted the help of two smart advisors, Tom Connelly and Kristen Jankowski, who helped me create an illustration that shows why planners need software simulating different economic scenarios.
Connelly is the founder and CEO of Versant Capital Management in Phoenix and chairman of the investment committee of the Arizona State Retirement System. Jankowski owns Financial Planning Outsource Services in Florham Park, N.J., and writes about 100 financial plans a year for advisors.
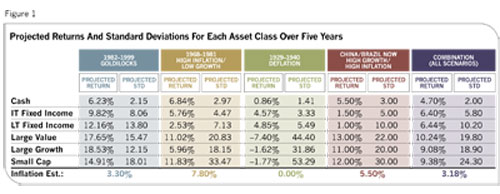
The three of us designed a crude, economically sensitive financial plan for a fictional couple. Connelly provided assumptions about the most-likely-to-prevail economic scenarios over the next five years: a Goldilocks economy (disinflation with moderate growth), deflation (negative growth), stagflation (low growth with high inflation), and a "Go-Go" situation (high inflation with high growth). To make five-year forecasts about returns, standard deviations, correlation coefficients and inflation, Connelly drew from past data.
For the Goldilocks scenario, Connelly used data from January 1981 through December 31, 2000. The high-inflation/low-growth scenario used data from the start of 1968 through the end of 1981. We used the Great Depression to derive inputs about a deflationary environment, using return, risk, and inflation data from 1929 to 1940. Finally, the high-growth/high inflation scenario was modeled on recent financial and economic statistics generated by China and Brazil.
To simulate the impact each scenario might have on a financial plan, Jankowski, a CFP and MBA, keyed the return, risk and inflation data into MoneyGuide Pro's Monte Carlo simulation engine. To keep the model simple, we used the application's default correlation coefficients for asset classes. To its credit, MGP allows an advisor to input his own assumptions when making a Monte Carlo simulation (not all planning programs give you the freedom). Most planners use the default Monte Carlo setting in planning apps. But these assumptions are not foolproof, as you are about to see, especially when you are trying to anticipate something like the 100-year flood the economy has just been through.
Jankowski created a fictional couple, whom we'll call the Smiths, both aged 64 and retired. Larry has an IRA with $350,000 and Joan has qualified plan assets totaling $200,000. They also have another $50,000 in savings and cash. Their mortgage is paid off, but they face expenses of $53,000. Larry receives $24,000 a year in Social Security benefits, while Joan gets $12,000 in benefits.
To keep the model simple, Jankowski assumed they would use the same static conservative asset allocation over the five years and across all four economic scenarios: 5% in cash, 30% in intermediate-term income, 25% in long-term fixed income, 15% in large growth stocks, 15% in large value stocks and 10% in small-cap stocks.
The results show that in five years the Smiths, in a Goldilocks economic environment, face a best-case scenario of $875,319. In a worst-case scenario, however, a deflationary environment, they'll see their $600,000 nest egg fall to $397,959-less than half of what they'd have in the best case. Weighting a portfolio using our assumptions for the probability of each economic scenario occurring, the portfolio will be worth $632,276 after five years.
What's troubling, however, is that most people would not project a Goldilocks outcome over the next five years. A 9.5% real return seems to be a remote possibility. In fact, the deflationary scenario is looking more realistic, as James Bullard, president of the Federal Reserve Bank of St. Louis, warned that the Fed's policies were putting the economy at risk of a Japanese style deflation. At the same time, the growing evidence of a double-dip recession has driven investors to less risky assets-toward bonds and away from stocks.
Worse, advisors will find it hard in a deflationary recession to model financial plans. Even if they put the statistical inputs into MoneyGuide Pro, the application does not allow a negative inflation rate. The best they can do is model a zero inflation rate. Thus, accurately showing the Smiths in a financial plan how a deflationary cycle would hurt their retirement is far too complicated. And yet still necessary in this environment.
Put aside the fact that planners are often ill-equipped to judge the probability of one economic scenario over another and to attribute returns, standard deviations and correlation coefficients to differing regimes. Indeed, many planners are not nearly so analytical in their approach and are more focused on relationships, service and sales.
So the solution has to be better software. "Financial planning software applications used by CFPs all generally work the same," says Jankowski. "The assumptions built into the plan are typically based upon a single table in the software system, which uses a single set of assumptions regarding returns and standard deviations for each asset class for the entire plan period, which could be 30 or even 50 years depending upon the age of the client."
She adds that the financial planner community should challenge the way plans are currently being performed.
Though MoneyGuide's user-friendly goal-based approach set a new standard, planners will need another burst of innovation to create more sophisticated models in the future. Software that might point the way has been created for large institutional investors by money manager Mark Kritzman.
Kritzman is the president and CEO of Windham Capital Management in Boston, which manages about $35 billion and advises about 200 of the world's 250 largest investors. His firm's software development arm has built an application to conduct economic scenario investment plans for institutions. It's pricy at $12,000 a year (a $2,000 version for advisors failed to sell). But even if it's out of your price range, the underlying fundamentals of the program deserve attention, as they cut right to the heart of scenario planning.
Kritzman and his team use a statistical procedure for partitioning historical returns into periods of turbulence and calm in markets and apply this to portfolio construction. A set of returns is statistically unusual if one or more of the returns are much above or below average or if the returns interact in an uncharacteristic fashion.
"A day or a month is turbulent if the returns across a set of assets behave in a significantly uncharacteristic fashion," Kritzman explained in an October 2008 research paper. "One or more assets' returns, for example, may be unusually high or low, or two assets which are highly positively correlated may move in the opposite direction."
Say you want to illustrate the impact of a high-interest-rate/high-inflation environment on a model portfolio. You would identify a period in history characterized by high rates and high inflation and use the software's pull-down menu to define the period's start and end dates. This period's returns, standard deviations and correlation coefficients are then automatically applied to your portfolio. Using software like this, advisors do not have to manually change the statistical inputs to run a simulation. You can model an economic scenario in just a few clicks.
Another statistical aid in the Windham software applies a "decay factor" to risk and returns, a method for weighting more recent events more heavily (since current returns and risk are usually more important in designing forecasts than older data).
Another problem tackled by Windham Portfolio Advisor is value at risk. "Financial planners tend to focus on just the distribution of outcomes at the end of some horizon," says Kritzman, "and do not pay much attention to what may happen along the way." While the terminal value of a portfolio modeled in financial planning software might be acceptable after 20 or 30 years, the portfolio could dip drastically in value in the meantime-and an investor in bad times might abandon the portfolio altogether before making it to the end. Again, by simulating the effects of turbulent periods, you can show investors the ups and downs he is likely to face by following his investment road map.
Financial planning has always lagged ideas applied in academia and institutions by ten to 20 years, but that knowledge gap is likely to close in the future.
Advisors will need planning apps by the popular software makers to overlay economic scenarios on financial plans. Meanwhile, software companies will need to enlist economists to regularly update apps with the most likely economic scenarios. Advisors must be able to combine three or four of the most likely economic scenarios into a single forecast and then optimize a portfolio to capitalize on what's expected.
The technology and statistical methods make this kind of financial planning for the masses doable. The only question is whether it will be here in time to help clients understand the mess we're in and whether it will help us avoid the worst damage.
Editor-at-large Andrew Gluck, a veteran financial writer, owns Advisor Products Inc., a marketing technology company serving 1,800 advisory firms.