


Then the storm came. Wind and falling trees took down power lines, leaving their neighborhood very much in the dark for two weeks. Although they didn’t live near any lakes or rivers, the sudden deluge flooded the streets – and their once beautiful basement. Without electricity, the sump pumps sat quietly under four feet of water, with the ruined entertainment center, exercise equipment, furnace and hot water heater.
At least they had insurance. The insurance covered damage to all kinds of property from a great variety of causes, but unfortunately for the family, flooding from a backup of groundwater was not among them. The protection they thought they had been paying for all those years just wasn’t there. They were not alone. While some of their neighbors had been advised to add a groundwater rider to their policies, others had not and found themselves in the same sad situation. While they all understood the big picture benefits of homeowners’ insurance, some didn’t fully understand the details and limitations of the policies they owned. If only they had known…
One of the ways investors aim to protect themselves from unacceptable losses in their stock portfolios is through diversification. The big picture concept of the potential benefit of diversification is simple: owning a large number of stocks is intended to reduce the negative impact on a portfolio if something bad happens to one of them. An increasingly popular way to “buy” this kind of protection is through the use of index funds. According to the 2015 Investment Company Fact Book published by the Investment Company Institute (ICI):
Just how much diversification protection does an index fund that holds around 500 stocks really offer? Let’s take a closer look at how the S&P 500 Index is put together to see if we can get a fuller understanding of the kind of equity exposure a fund designed to track this very popular index might offer.
The S&P 500 is a capitalization weighted index, which means each stock in the index is weighted based on the value of its stock price multiplied by its number of shares. The market capitalization is essentially the market value “footprint” of the company – the value the market has placed on the company.
Using data from our Bloomberg terminal to examine the details of the S&P 500 Index, we find that as of June 30:
The notion that good news at a small company like QEP Resources will diversify away bad news at a big company like Apple that has 221 times its weight in the index just doesn’t add up.
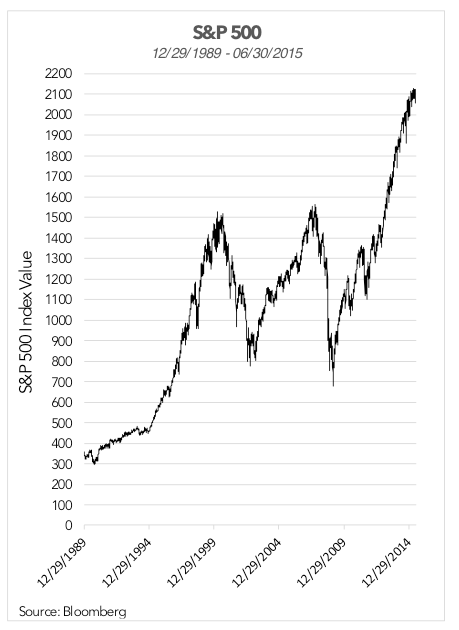
Maybe the answer depends on how many disasters you’ve already lived through, and how much damage you’ve had to recover from. Investors who were tracking the S&P 500 on March 24, 2000 saw the index plummet 49% by October 9, 2002. Over the next five years the S&P clawed its way back to a 2.5% gain by October 9, 2007. It had been 7½ years since it peaked in 2000.
And then it plunged again, this time losing 57% by March 9, 2009. If investors had been tracking the index throughout that decline, they would have watched each $100,000 invested reduced to $43,000 by the time it was over. If only they had known… Imagine a very nice family living in a very nice neighborhood in an especially beautiful and very nice home. They have lived there for a little over seven years now, and have been very happy. A few years ago they invested in finishing the basement, turning it into a beautiful family space with an entertainment center, exercise equipment, and separate room for the furnace and hot water heater. They even added a pair of sump pumps to protect their investment. Because their home made up a big part of their family wealth, they paid for homeowners’ insurance every month. It felt good to know that if something bad happened, they would be protected from a catastrophic financial loss.
Of course, worrying about how an index, and the hundreds of billions of dollars invested to track an index, might fare in a stormy market may seem out of step with what’s popular now. After all, the S&P 500 has been on the rise for years without a serious correction. Why prepare for a flooded basement on a sunny day?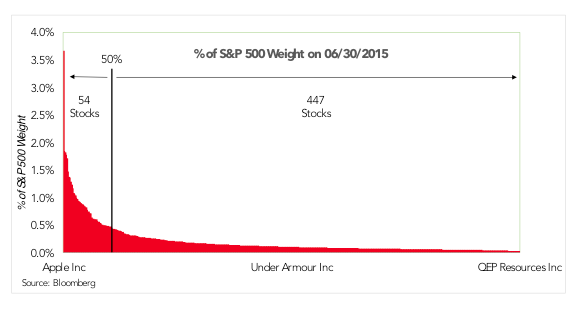
Caveat Emptor (“Let The Buyer Beware”) Of Index Funds
August 10, 2015
« Previous Article
| Next Article »
Login in order to post a comment