I knew that I had to adopt a cold, unemotional attitude towards stocks; that I must not fall in love with them when they rose and I must not get angry when they fell; that there are no such animals as good or bad stocks. There are only rising and falling stocks – and I should hold the rising ones and sell those that fall. I knew that to do this I had to achieve something much more difficult than anything before. I had to bring my emotions – fear, hope and greed – under complete control. I had no doubt that this would require a great amount of self-discipline, but I felt like a man who knew a room could be lit up and was fumbling for the switches. . . . I started to see that stocks have characters just like people. This is not so illogical, because they faithfully reflect the character of the people who buy and sell them.
Like human beings, stocks behave differently. Some of them are calm, slow, and conservative. Others are jumpy, nervous, and tense. Some of them I found easy to predict. They were consistent in their moves, logical in their behavior. They were like dependable friends. And some of them I could not handle. Each time I brought them they did me injury. There was something almost human in their behavior. They did not seem to want me. They reminded me of a man to whom you try to be friendly but who thinks you have insulted him and so he slaps you. I began to take the view that if these stocks slapped me twice I would refuse to touch them anymore. I would just shake off the blow and go away to buy something I could handle better. . . . I tried to detect those stocks that resisted the decline. I reasoned that if they could swim against the stream, they were the ones that would advance most rapidly when the current changed.
After a while, when the first initial break in the market wore off, my opportunity came. Certain stocks began to resist the downward trend. They still fell, but while the majority dropped easily, following the mood of general market, these stocks gave ground grudgingly. I could almost feel their reluctance. On closer examination, I found the majority of these were companies whose earnings trends pointed sharply upward. The conclusion was obvious: capital was flowing into these stocks, even in a bad market. This capital was following earning improvements as a dog follows a scent. This discovery opened my eyes to a completely new perspective.
I saw that it is true that stocks are the slaves of earnings power. Consequently, I decided that while there may be many reasons behind any stock movement, I would look for one [thing]: improving earnings power, or anticipation of it. To do that, I would marry my technical approach to the fundamental one. I would select stocks on their technical action in the market, but I would only buy them when I could give improving earnings power as my fundamental reason for doing so.
. . . Nicolas Dravas, How I Made $2,000,000 in the Stock Market
Read that last paragraph, and then read it again, because the wisdom of those words is profound! It is particularly significant since we believe the equity markets are transitioning from an interest rate-driven bull market to an earnings-driven bull market. Indeed, we think the “profits recession” troughed in 2Q16 and that easy earnings comparisons will be seen in 3Q and 4Q of this year. Now many strategists and analysts downplay such an earnings improvement as being driven by “easy earnings comparisons,” but as our friend Rich Bernstein writes: “However, every profits cycle, by definition, begins with a series of easy comparisons. It is impossible to begin a cycle with difficult comparisons.”
Meanwhile, select pundits continue to predict a calamitous end to this secular bull market. Hereto, Rich Bernstein of Richard Bernstein Advisors (RBA) writes:
Some market observers have cautioned that overvaluation always leads to poor returns because multiples contract. There is indeed history to support such concerns. However, the key word is “always.” As we have shown, there have been many periods in stock market history during which earnings growth improves, interest rates increase, PE multiples contract, and a bull market continues. They are called earnings-driven bull markets. It is always headline-grabbing to predict a calamitous end to a bull market, and a broad range of sentiment data strongly suggests investors are quite scared. At RBA, however, we continue to swim against that fearful tide, and our portfolios are positioned for a cyclical rebound in earnings and an earnings-driven bull market.
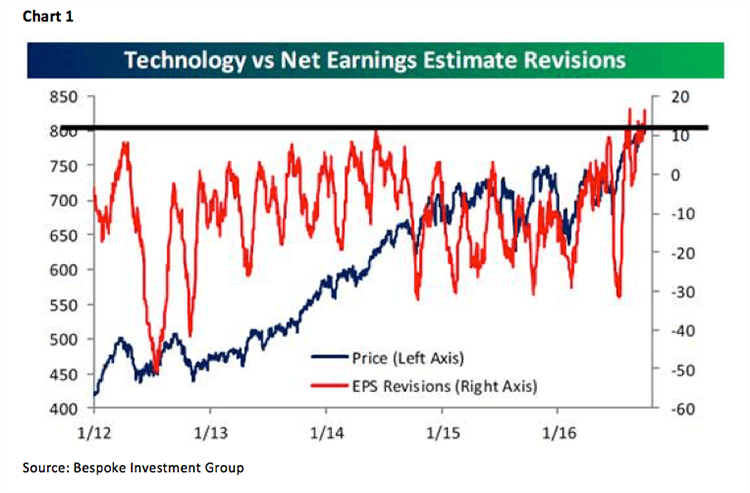
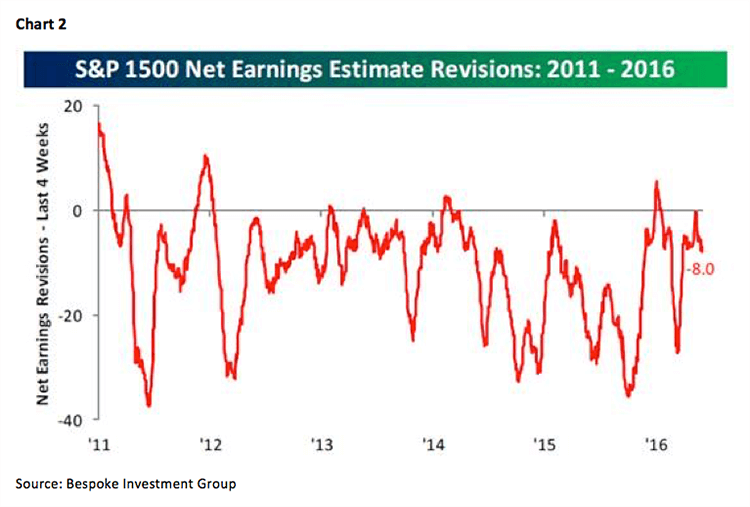
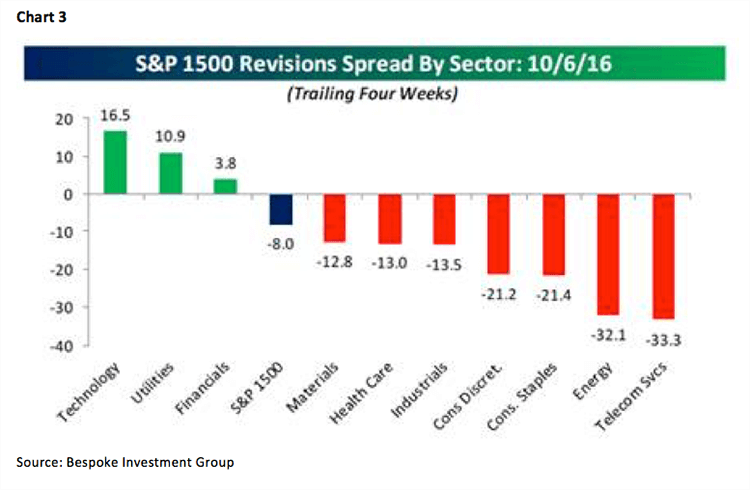
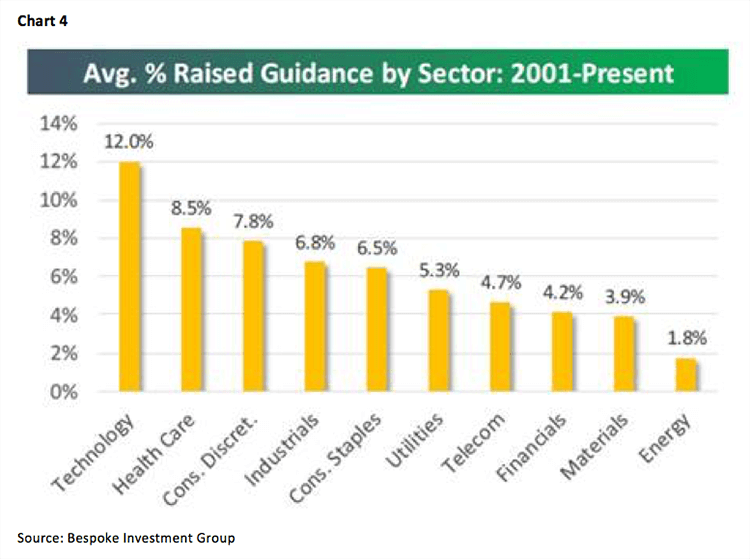
Sticking with the “earnings” theme, 3Q16 earnings season begins this week when Alcoa reports. Of interest, at least to Andrew and I, is that more fundamental analysts are raising their earnings estimates on the Technology sector than lowering them (see chart 1 on page 3). Obviously, that is music to our ears, because we have recommended a large portfolio overweighting in Technology. Meanwhile, net earnings revisions for the S&P 500 continue to be negative but to a lesser degree (chart 2). Interestingly, earnings revisions by sector are favoring Technology, Utilities, and Financials (chart 3 on page 4), while the percentage of raised guidance by sector is also worth consideration (chart 4). Nevertheless, recall that, going into 2Q16 earnings season, we opined earnings were going to “come in” better than the lowered-bar expectations. Bingo! . . . Last quarter, 64% of reporting companies beat their earnings estimates and 57% beat their revenue estimates. We expect the same kind of results (or better) for 3Q16.
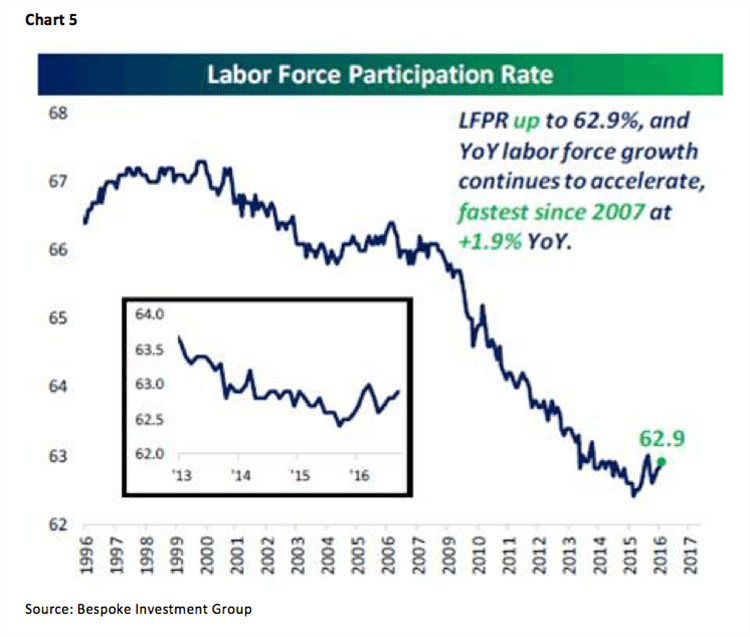
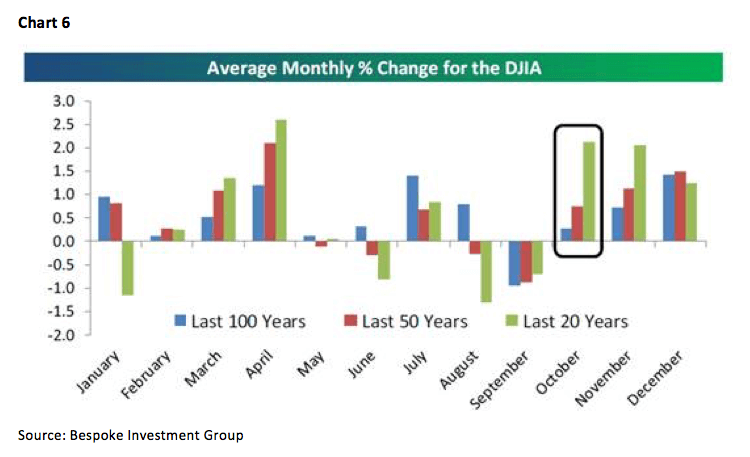
Within the bookends of last week there were some significant events: 1) the yield on the 10-year T’note surged from 1.59% to 1.72%; 2) higher rates caused the U.S. Dollar Index to rise as the British Pound collapsed versus the greenback last Friday; 3) rising rates left the defensive stocks (we have termed them “chicken longs”) under pressure, because most of them pay high dividends and most of them are very expensive, as we have suggested for months; 4) another “defensive play” fell last week as gold traded lower and tagged its 200-day moving average; 5) crude oil had a very good week for a multiplicity of reasons; 6) the ISMs had their biggest monthly rise ever (read: no recession); 7) the employment report was not as bad as the media said; 8) the Labor Force Participation Rate looks to have bottomed (chart 5 on page 5); 9) Bullish stock sentiment has been below 40 for 49 weeks (historic); 10) seasonal factors favor the “bulls” as we move into mid-October, which is the second best month of the year for the past 20 years (chart 6); and the list goes on.
Speaking to the recently stronger dollar, while longer term we think the U.S. Dollar Index has traced out a giant top in the charts, near term the dollar could trade higher given the higher environment of short-term higher interest rates. Historically, periods of dollar strength tend to see stocks with the majority of their revenues coming from the U.S. to outperform. Therefore, for your potential “buy lists,” we have screened stocks from the Russell 1000 that have large domestic revenues, are favorably rated by our fundamental analysts, have attractive long-term chart patterns, and have positive metrics on our proprietary algorithms: Sun Trust (STI/$45.69/Outperform), Incyte (INCY/$97.83/Outperform), Laboratory Corp of America (LH/$138.87/Outperform), Union Pacific (UNP/$98.07/Strong Buy), Booz Allen (BAH/$30.19/Outperform), and Vantiv (VNTV/$56.48/Outperform).
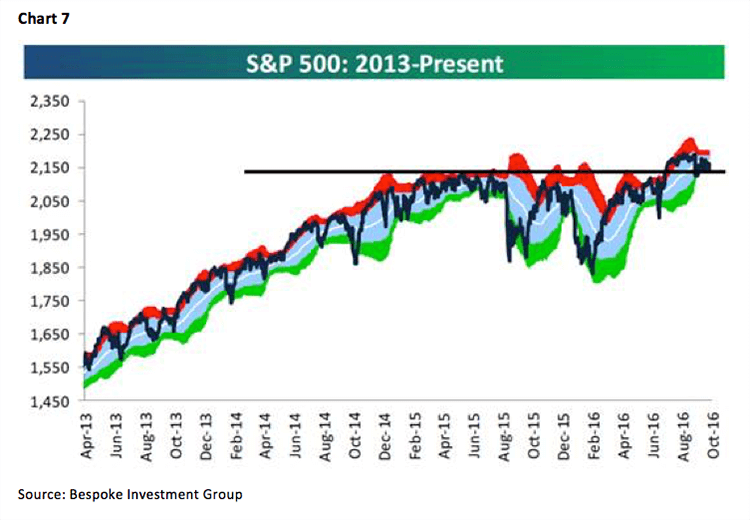
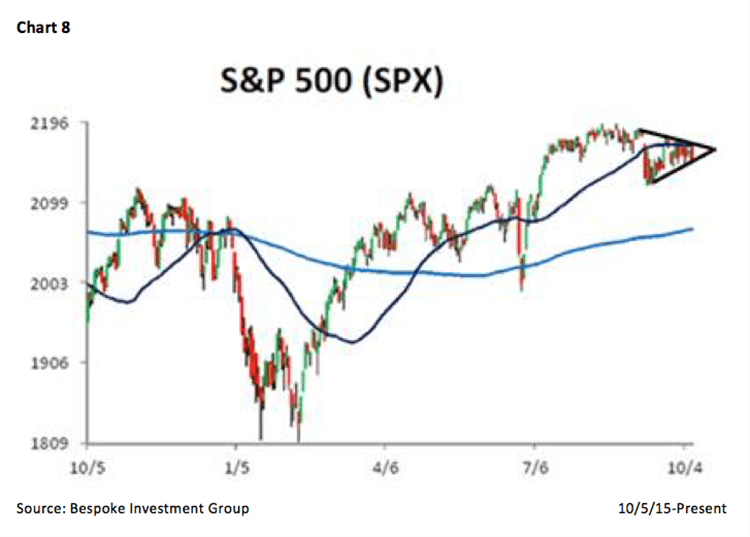
The call for this week: Despite the bravado, the reality is seen in the chart of the S&P 500 (SPX/2153.74), which in early July, broke out to the upside of nearly a two-year trading range with bullish implications (chart 7 on page 6). More recently, we have targeted the triangle chart formation the SPX has worked itself into since early September (chart 8 on page 6). The SPX is now at the apex of that triangle and should be resolved with either a break to the upside or the downside. A break up would obviously have positive ramifications, while a break down would suggest further consolidation. As stated, there is a decent chance our models’ prediction of downside vulnerability in the mid/late September timeframe may be over, but it will take a close above 2187 by the SPX to turn our models positive. If that happens, it would suggest the equity markets will grind higher into 1Q17, which would surprise the greatest number of participants. However, until our models “flip” positive, we continue to exercise patience.
Jeffrey D. Saut is chief investment strategist at Raymond James.