


It has been a rough start to 2016 for the stock market. In fact, it’s been one of the worst starts to a year in the history of the S&P 500. This week we look at how stocks have done historically after other similarly bad starts, compare current fundamental and technical conditions to prior bear market lows, and discuss some potential catalysts that could help turn stocks around. While recession odds have risen (we place the odds at about 30%), we do not expect the S&P 500, down 12.5% from 2015 highs, to enter a bear market.
Down 8.8% though 29 trading days, 2016 is the third worst start for stocks over the past nearly 90 years. Going back all the way to 1928, the S&P 500 Index (and its predecessor S&P Index) has been down at least 5% on the 29th trading day of the year 19 other times. So what has happened the rest of the year? The good news is that after a bad start, for the rest of the year the S&P 500 has averaged a gain of 5.3% (the median is also 5.3%), and the rest of the year has been positive 58% of the time. The best rallies after bad starts were 49% in 1935 and 36% in 2003. Going back 40 years, the S&P 500 has been down 5% or more after 29 trading days 10 other times besides this year. The rest of the year was down more than 10% only once, in 2008. That year saw a 33% drop from the 29th trading day until the end of the year. In other words, a sizable drop from here for the rest of the year would be extremely rare [Figure 1].
Historical Perspective
Market-based indicators suggest bonds have priced in more bad news than stocks. Credit spreads are wider than they were at the October 1998 and March 2003 stock market lows, and close to August 2011 spreads, even though stocks have not corrected as much as they did in August 2011. But stock valuations are well above 2009 and 2011 troughs, and in-line with the March 2003 lows. On the surface, these comparisons suggest more potential near-term downside for stocks; however, given the economic cycle is in its latter stages, we think stock valuations are fair, and envision a scenario where credit markets may stabilize before stocks begin a sustained move higher.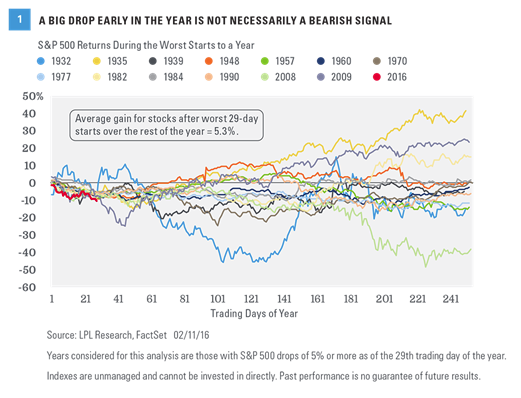
With stocks down about 9% year to date and 12.5% lower than 2015 highs (and everyone wondering where the bottom is), we compare technical, sentiment, and fundamental indicators today to levels at prior bear market lows to assess the likelihood stocks may have bottomed. Generally, these indicators provide some comfort that the sell-off may be near its end and highlight relatively better fundamentals [Figure 2].