For decades, the defined contribution industry has focused on the performance of individual funds at the expense of other plan metrics. In this paper, we analyze a series of variables - fund selection, asset allocation, portfolio rebalancing, and increasing deferral rates - to determine which factors may have the greatest potential impact on an individual's portfolio. Our analysis suggests that putting fund performance front and center in terms of the plan sponsor's priorities is an error with far-reaching implications. That is not to say that fund performance does not matter, but our analysis suggests it is a much less powerful variable compared with asset allocation and, most of all, higher deferral rates.
What Matters Most?
In this study, we begin with the question "What matters most?" - asking it on behalf of DC plan sponsors and participants who wish to secure better retirement savings outcomes. Since the advent of DC plans, the lion's share of attention has focused on fund performance. Indeed, on an annual and even more frequent basis, plan sponsors have long sought to identify and stock their DC plans with the best-equipped investment vehicles for growing participant wealth. Furthermore, in accordance with their role as fiduciaries, plan sponsors have spent significant time and resources educating their participants about the value of diversification, portfolio rebalancing, and saving more. But which of these factors matters most? Or do they rate about evenly in terms of their importance? What is the best use of the plan sponsor's time and energy?
In pursuit of answers to these questions, this study quantifies the hypothetical impact of individual fund performance using several fund selection methodologies. It then moves to an assessment of asset allocation, rebalancing, and deferral rate increases. The end goal is to quantify the practical impact of specific tactics that may help steer plan sponsors and advisors away from an excessive, fund-centric focus. As we will show, there may be better ways to spend your time.
The Base Case
We begin our analysis by formulating a base-case investment scenario for an individual's portfolio. We assume the individual was 28 years old in 1982, earned an income of $25,000 per year, and received a 3% annual cost-of-living increase. Because it falls close to the inception of defined contribution plans in the United States, 1982 is a good year in which to start our analysis. In addition, the individual's $25,000 annual salary is in line with Bureau of Labor Statistics data reporting average salaries for a variety of professional classes at the time. The 401(k) plan available to this individual offers a match of $0.50 on the dollar up to 6%. Furthermore, this person was invested in a conservative asset allocation across six asset classes. Also, as an important controlling factor in our study, for each asset class we assume contributions are invested in a 4th-quartile fund - a fund ranking among the bottom 25% of its Lipper peer group - based on three-year performance data. We also assume that the individual deferred 3% of gross salary into the plan, that there is no rebalancing of account assets, and that no asset allocation changes are made over time. Twenty-nine years later, the individual was 57 years old, earned an income of $57,198 per year, and had a 401(k) balance of $136,400.
1. The First Driver: Fund Selection
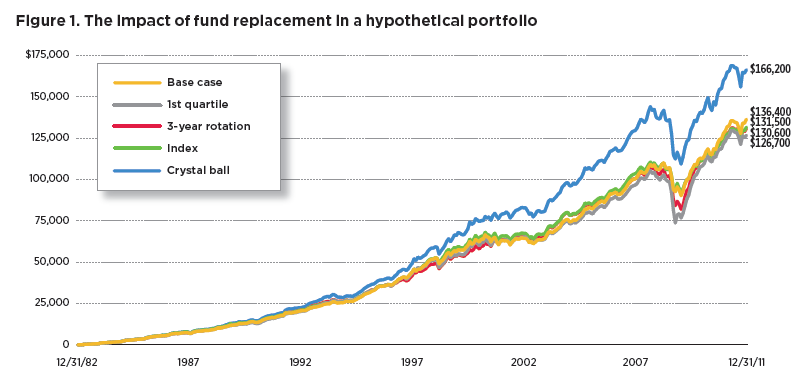
From our base case (4th quartile fund selection), we will now investigate drivers of retirement wealth accumulation by considering the impact of having a different fund lineup. Rather than the 4th-quartile portfolio, we will look at four other fund selection scenarios, three of which might generally be regarded as realistic strategies, with the fourth being unrealistically "perfect."1
First Quartile. The first hypothetical scenario is a buy-and-hold strategy in which only 1st-quartile funds (at or near the 25th percentile) were held for the 29-year investing period. That is, we substitute 1st-quartile funds, based on their three-year ranking as of December 31, 1982, instead of using 4th-quartile funds, and assume the individual holds these funds, as in the base case, throughout the 29-year time frame.
Three-Year Rotation. In the second hypothetical scenario, we select an initial lineup of 1st-quartile funds, again based on three-year peer-relative performance, but this time, to the extent that funds have fallen out of the 1st quartile after three years, we replace them with new 1st-quartile funds (funds at or near the 25th percentile). This process repeats itself every three years. This is a typical practice employed by many plan sponsors as they seek to comply with their Investment Policy Statement.
Index Funds. In the third hypothetical scenario, we assume that rather than focus on actively managed funds, the plan sponsor seeks to reduce cost by choosing index funds. These investments are assumed to be held for the entire period under analysis.
Crystal Ball. In this hypothetical scenario, we assume that the plan sponsor would have used a crystal ball to predict funds in the 1st quartile for the next three-year period and accordingly put these in place ahead of time on a rolling three-year basis. If it were possible, this strategy will always give the individual marginally better investment returns.
Interestingly, regardless of strategy, fund selection generated roughly the same amount of wealth (Figure 1). The crystal ball strategy improved the base case by roughly $30,000. Having perfect foresight and being able to predict future 1st-quartile funds would have improved the individual's outcome by a 22% cumulative difference above the $136,400 obtained in the basecase strategy.
What is surprising is that in the study the best strategy that one could implement was the base case itself, where terminal wealth was between roughly $5,000 and $10,000 ahead of the indexing, three-year rotation, and 1st-quartile strategies. This illustration offers an important caution for those who think that a fund's track record is an indication of its future success. It would sound prudent to put a 1st-quartile strategy in place, or to monitor and manage the lineup so it always made "good" funds available to participants. But when we map out the alternatives, the differences - even over a long time frame - are relatively small, and importantly, changing a plan's underlying funds for justifiable seeming reasons may in fact detract from performance.
2. The Second Driver: Asset Allocation
Turning from investment selection, we look next at the potential impact of adjusting the portfolio's asset allocation. After all, if the base case relies on a conservative portfolio allocation, perhaps a larger allocation to equities and a smaller allocation to fixed-income components could have a meaningful impact on portfolio results, particularly over a time frame of 29 years.
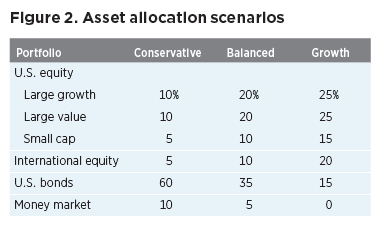
Leaving the 4th-quartile base portfolio in place, we dial up its risk/return profile, taking the asset mix from a conservative model (30% equity) to a balanced (60% equity) as well as to a growth (80% equity) model. Figure 2 breaks down each asset allocation into equity and fixed-income subcategories that map onto the Lipper classifications used in our study.
When we calculate returns for these hypothetical portfolios over our 29-year time frame, it appears that results would be moderately better in both the balanced and growth portfolio models, which returned approximately $14,000 and $23,000 more, respectively, than the base-case portfolio (Figure 3).
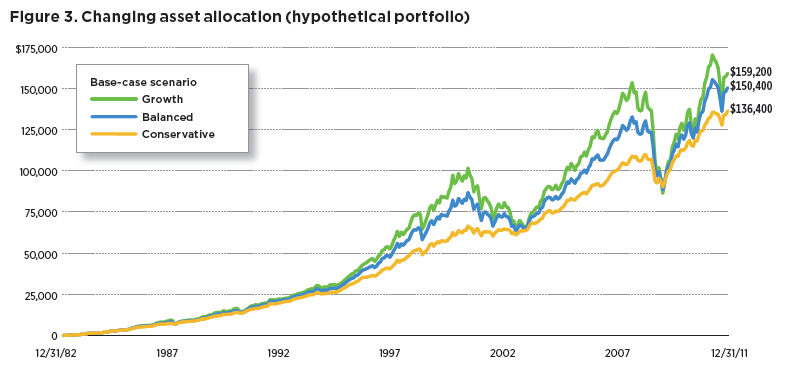
But as Figure 3 demonstrates, these higher returns come with the risk of substantially higher volatility. The conservative
portfolio weathered down-market periods much better than either the balanced or growth portfolio. Thus, while the period in question suggests that asset allocation can be a bigger driver of portfolio returns than the composition of the underlying funds, asset allocation changes carry material risks of severe declines in uncooperative markets.
3. The Third Driver: Account Rebalancing
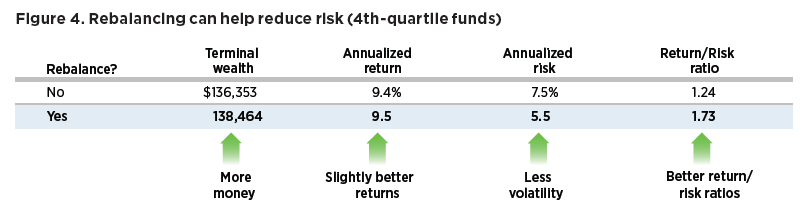
The third factor we seek to quantify is quarterly account rebalancing. To model this regular portfolio adjustment, we will use the base-case, 4th-quartile conservative fund selection strategy described earlier. We find that rebalancing this portfolio produces slightly greater retirement wealth, but with lower volatility (Figure 4).
Ultimately, a plan is only as good as its ability to keep an investor on track, so producing steadier returns with less fluctuation may help participants stick to their plan. Having said that, the better return/risk ratio in our example does not carry an outsize benefit in terms of absolute annualized return, suggesting it may rank somewhere between asset allocation changes and fund selection in terms of its importance as a driver of longterm returns.
Data are historical and based on hypothetical conservative asset allocation portfolio rebalanced quarterly, outlined in Section 3. Past performance is not a guarantee of future results. More recent returns may be higher or lower than those shown. Investment return and principal value will fluctuate, and shares, when redeemed, may be worth more or less than their original cost.
4. The Fourth Driver: Deferral Rates
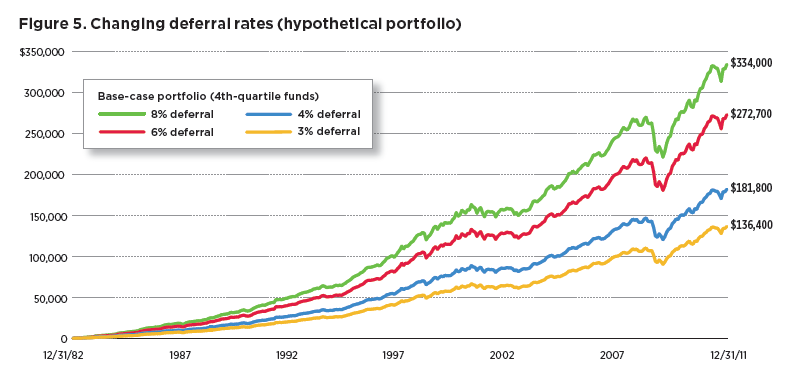
Next and lastly, we investigate the impact of higher deferral rates on the individual's wealth accumulation. Very quickly, it becomes clear that the incremental impact of higher deferral rates can be one of the most significant drivers of long-term returns (Figure 5).
It should come as no surprise that if one saves and invests more, then one might be more likely to accumulate greater wealth. But, as Figure 5 suggests, the size of the difference in terminal wealth can be dramatic. As we dial up the individual's contribution from 3% of income to 4%, 6%, and 8%, the final balance after 29 years jumps from $136,000 to $181,000, $272,000, and $334,000, respectively. Interestingly, even a 4% deferral - which represents a 1% increase that does not take advantage of the plan's full matching contribution - would have had a wealth accumulation impact 30% larger than the crystal ball fund selection strategy, nearly 100% larger than the growth allocation strategy, and approximately 2,000% larger than rebalancing. Putting deferral rate changes in these terms, the performance of underlying funds and rebalancing, in particular, appear to become far less meaningful when compared with the impact of higher deferral rates.
Implications For Plan Design And Participant Education
Readers may observe that the remarkable difference in wealth afforded through higher deferral rates affects the individual's portfolio only, and does not concern the overall performance of the plan. While this is true in certain respects - as we have modeled the effects of different factors on the wealth accumulation potential of an individual rather than an entire plan base - it is more important to recognize that our analysis suggests a hierarchy of priorities for plan sponsor activity.
How should plan sponsors and their advisors spend their time? Should they focus on fund selection, asset allocation, rebalancing, or increasing deferral rates? After decades of experience, we now know that for the vast majority of participants, inertia rules the day.
Against this behavioral bias, our data suggest that focusing on helping eligible employees enroll and/or increase their deferrals into their DC plan is a good way to help boost wealth accumulation potential. For this reason, we feel that services such as auto-enrollment and auto-deferral increases are two critical best practices that plan sponsors should consider implementing.
Data are historical and based on hypothetical investment scenarios outlined in Section 4. Past performance is not a guarantee of future results. More recent returns may be higher or lower than those shown. Investment return and principal value will fluctuate, and shares, when redeemed, may be worth more or less than their original cost.
Data are historical. Past performance is not a guarantee of future results. More recent returns may be higher or lower than those shown. Investment return and principal value will fluctuate, and shares, when redeemed, may be worth more or less than their original cost.
Importantly, these features do not carry high fiduciary risk. Compared with the practice of offering employee education and/or advisory services in an attempt to migrate participants toward more aggressive asset mixes - activities that carry higher fiduciary risk and may require expensive or complicated communication initiatives whose potential is uncertain - a focus on higher deferral rates has a low total cost to the plan sponsor and enormous upside potential for participants.
While plan sponsors may recognize the need to increase savings, 74.3% of plans utilize automatic enrollment at a deferral rate of 3% or less. For many plan sponsors, this is an attempt to increase participation in a way that will not dramatically impact the participant's wallet. By contrast, 62.1% do not have an automatic escalation provision.2
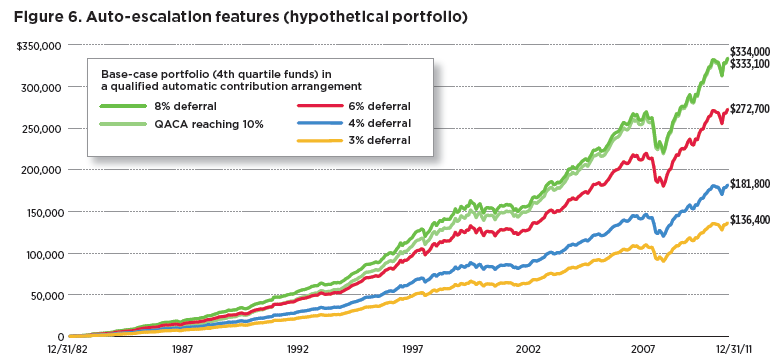
The Pension Protection Act of 2006 introduced a Safe Harbor provision that offers a solution to this problem. As Figure 6 shows, a qualified automatic contribution arrangement (QACA) that increases an individual participant's deferral rates from 3% to 10% by one percentage point annually - and then maintains a 10% deferral rate thereafter - would have roughly the same impact as an 8% deferral rate over the 29-year time frame employed in our study. Clearly, auto-escalation features can play a vital role in helping secure substantially higher savings for plan participants, particularly the majority of savers who have historically tended to participate passively in their plans.
Conclusion
For many years, fund performance has taken center stage in the discussion of DC plan effectiveness and how to improve it. With the present study, we hope to shift the emphasis of that discussion to deferral rates - and the ways in which plan design and employee education can be leveraged to raise deferral rates for eligible participants. The foregoing analysis is not intended to suggest that underlying fund performance is not important. Rather, it is intended to show that a number of variables are at work in determining plan effectiveness.
These are:
Deferral rates and plan design
Asset allocation
Rebalancing behavior
Individual fund performance
We contend that the industry would do well to bear this hierarchy in mind when considering ways to boost retirement preparedness. As we look at the progress participants are making toward securing a better retirement savings outcome, deferral rates are one of the most important factors to stress, whether in communication to participants about how to accumulate more wealth or in restructuring DC plans for better saving and investing success.
W. Van Harlow, Ph.D., CFA, is the director of research at the Putnam Institute.
1 See notes on methodology at the end of this paper for more details.
2 Source: Profit Sharing Council of America 53rd Annual Survey, 2011.