


Part of the problem for the developed world is that much of its economy is now in the services sector. It is much harder to get increases in productivity in dry cleaners, restaurants, and hairdressers than it is in manufacturing or in agriculture. While there is continual growth and improving productivity in the services sector, that sector alone cannot deliver significant increases in the overall productivity rate.
And now back to population and employment, our main focus.
So Whom Can You Depend On?
To varying degrees, the nations of the developed world are getting older. This is happening for two basic reasons:
- Improved nutrition and healthcare enable people to live longer.
- Fertility rates are falling toward replacement rate or even lower.
No trend persists forever, but the older-world trend is likely to continue unless something happens to reduce average lifespans and/or produce more babies.
Developed-world aging produces all kinds of economic consequences, in particular for the labor market. The total number of humans in a given place may be relatively constant or even rise, while the number of workers who can actually contribute to that place’s economy falls.
Child labor laws and customs vary. In the United States, the labor force theoretically consists of all those age 16 and over who are either working or actively seeking work. Retirement is fuzzier because people can retire around age 65, but many keep working either voluntarily or out of necessity.
As we saw last week, demographers use a statistic called the “dependency ratio,” which is the ratio of workers to the entire population. The lower the percentage of workers, the bigger each worker’s responsibility becomes for providing support to young and old dependents, either directly or through taxes.
To illustrate, here is a chart from Eurostat on the projections for the EU population from 2014 to 2080.
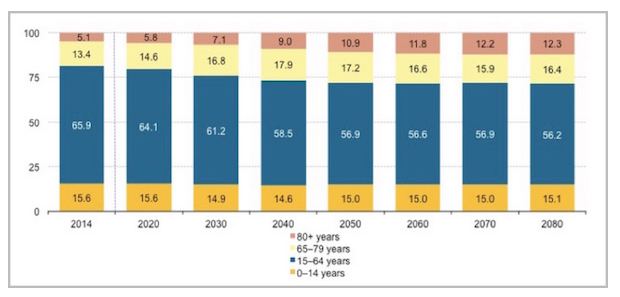
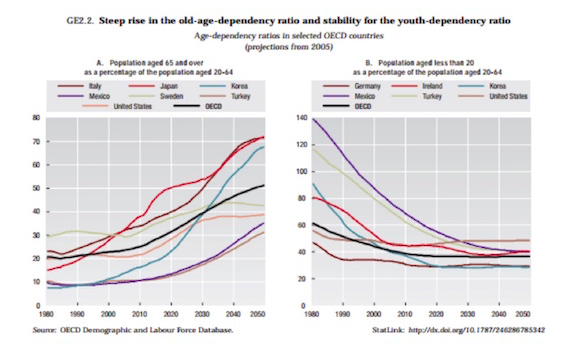
We see that in 2014, 65.9% of the EU was aged 15–64, or what we might call “prime working age.” The number shrinks steadily to around 56% by 2050 and then levels out. Why does it level out? Basically, because the forecasters assume that birthrates won’t drop much lower and that there is a limit on how long people will live. But in this next chart you can see the steep rise in the percentage of the elderly compared to those of working age, all over the developed world.
The number of children (ages 0–20) changes only slightly in the decades to come. The big change occurs in the top two segments on the previous chart, those aged 65–79 and 80+. Combined, they will grow from 18.5% of the population in 2014 to 28.7% in 2080.
These figures involve assumptions that could change. A top issue for Europe is how many immigrants it will accept and how fecund the immigrants will be compared to the current population.
Presuming, for the sake of argument, that ages 15–65 encompasses most workers, in 2014 the EU had 66% of its population working to support the 34% who were not working because they were either too young or too old. By 2040, less than 25 years from now, the EU is projected to have 58.5% working to support 41.5% who are dependents. About two-thirds of the dependents will be those age 65 and over.
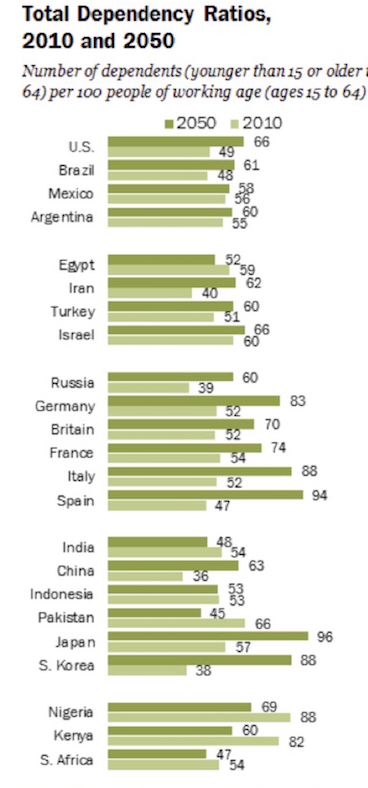
This next chart, from the Pew Research Center (based on UN data), gives us a view on how things will change between now and 2050 in a number of countries around the world. Note that Italy, Germany, and especially Spain will have significant problems with their dependency ratio within 30 years. Only Japan will have a higher dependency ratio than these three. Everyone talks about the aging of Japan, but Spain is not a great deal different; and after Spain’s last recession, so many young people left the country that the statistics are probably worse than what we are seeing in the data.
Can We Have a Little Economic Participation, Please?
Now, you might say that working-age people don’t really support the retirees. This assertion is true to the extent that retirees support themselves from savings. It is not true for retirees whose pensions depend on tax revenue and economic growth.
The number of people aged 15 to 65 doesn’t really equal the number of workers. We measure the number of actual workers by something called the participation rate. And because data for the participation rate is so robust in the United States, I’m going to focus on the US.
In the US, population growth has slowed, and productivity has fallen; that’s why we haven’t been able to boost real GDP growth to the levels seen in previous recoveries. The slow GDP growth we’ve seen in this recovery is precisely due to a much lower annual increase in employment.
What about the potential for future growth? If the “natural” unemployment rate is a little over 4% and the official unemployment rate is sitting at just about 5%, doesn’t that suggest there aren’t many more productive workers who can be added into the GDP growth mix? Actually, that is not the case. It’s really all about the participation rate.