


From its inception in October 2013 through May 31, 2015, it has realized an annualized return of 17.62%, compared with 14.58% for the index. So far this year through June 1, 2015, it has returned 5.50%. Morningstar, which classifies the fund in the large value group, ranked it first in that category in 2014. Through June 1 of this year, it ranked 6th out of 273 institutional classes of funds in the large value group.
Another attraction is the marquee names attached to the fund. The equity side features an index that combines the names of a Nobel Prize-winning economist in the world with a global fixed-income juggernaut. Since its launch in early 2010, DoubleLine has attracted some $75 billion in assets under management making it the most successful start-up in mutual fund history.
Not A Balanced Fund
Despite two distinct stock and bond sides, this is far from a typical balanced fund. Instead, it is managed to generate returns mainly from its equity index component, while the fixed-income side acts as something of an icing on the equity cake. Each investment dollar goes into an actively managed fixed-income portfolio of short- to intermediate-term securities designed to deliver long-term rates in line with LIBOR plus 250 basis points, with low volatility. Simultaneously, the fund enters an index swap to mirror the movement of the underlying index. By using the swap contracts, the fund gains 100% exposure to stocks while also investing in a portfolio of bonds. The portfolio has no financial leverage because no money is borrowed to increase the net exposure of the portfolio.
The equity side divides the equity market into 10 sectors, then finds the five that are most undervalued based on their CAPE ratios. The sector with the worst 12-month price momentum gets thrown out. This momentum factor is designed to avoid “value traps” that are cheap and are likely to get even cheaper. The index is then left with the remaining four equally weighted sectors, which represent the most undervalued sectors with the most positive price momentum. The process, which is market-cap weighted to preserve the large-cap flavor of the portfolio, is repeated monthly.
“The methodology takes a cue from behavioral finance because people fall in love with sectors, or avoid them, for prolonged periods,” Sherman says. “At the same time, the monthly rebalance helps the fund avoid short-term run-ups that lead to overvaluation.”
The fund’s value approach on the equity side differs from those of its competitors. “Most fund managers screen stocks at the individual security level, and they use a lot of the same valuation metrics,” he says. “We screen at the sector level. It’s a strategy that focuses on sector rotation rather than a security rotation.”
At the end of May, the index was evenly distributed between the health-care, technology, consumer staples and industrials sectors. The fund made its last sector allocation change in September 2014 when it tossed the energy sector and replaced it with consumer staples. According to the index, the two most overvalued sectors of the market are real estate and utilities. “These are two popular yield plays that have led investors to have a blatant disregard for valuation,” Sherman says. “This fund isn’t only about being in the right sectors. It’s also about avoiding the wrong ones.”
Historically, the value index the fund is based on has underperformed the market slightly during periods when growth stocks flourished, such as the run-up to the technology bubble between 1994 and 2000. However, it has outperformed in some of the market’s worst downdrafts. The most impressive of these outperformance periods occurred in 2000, when it rose 25% while the S&P 500 declined 9.1%.
Although the equity side is meant to be a key driver of returns, the fixed-income component has added octane to the mix. In 2014, 3.33% of the fund’s outperformance over the S&P 500 index was attributable to the bond side, while equities, represented by the Shiller Barclays CAPE US Sector Index, added 0.85% of outperformance. Over longer-term business cycles, Sherman expects the two sides’ contributions to outperformance to be roughly equal.
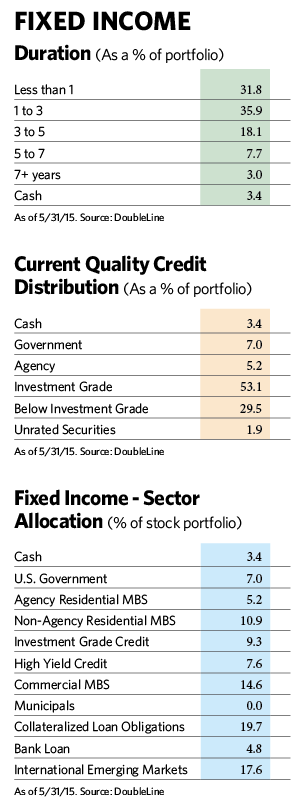
The bond portfolio has a short duration of just under two years to help minimize price erosion if interest rates rise. Although Sherman believes that any increase is unlikely this year, the incremental yield from the portfolio will offset that risk. About half the portfolio is in investment-grade bonds and about one-third is in bonds rated below investment grade. A mix of cash, government, agency and unrated securities round out the fixed-income roster.
A Predictive Tool, With Caveats
It’s hard to talk about the DoubleLine Shiller Enhanced CAPE fund without understanding the basis of the strategy, the cyclically adjusted price-to-earnings ratio. On its surface, the CAPE ratio looks like a traditional price-to-earnings ratio. But instead of using the most recent one-year trailing earnings, the ratio reaches back 10 years to reflect a complete market cycle and smooth out the effects of business cycle fluctuations, and it tacks on an inflation adjustment. Historically, a lower CAPE ratio for the market has signaled undervaluation and subsequently higher market returns; a higher one has signaled overvaluation and years of lower-than-average returns.
Robert J. Shiller and his colleague, John Campbell, created the CAPE ratio over 20 years ago. Shiller, a Nobel prize-winning economist and author of Irrational Exuberance, is best known as one of the names behind the S&P Case-Shiller Home Price Indices. To stock market investors, he is the brains behind a tool that has become one of the most carefully watched barometers of market valuation and long-term market direction. Using the CAPE ratio as a guide, Shiller gained a following as a market prognosticator when he sounded a warning call about high valuations just before stock market crashes in 1999 and 2007.
DoubleLine’s Smart-Beta Fund Is A Hit
July 1, 2015
« Previous Article
| Next Article »
Login in order to post a comment