Don’t worry about the January Barometer, which says, “As goes January, so goes the year.” Here we discuss the reliability of this indicator and several factors that may lead to better performance in February. We see opportunities in the stock market in 2016, but suggest caution in the near term as we await clarity on the key issues pressuring investor sentiment.
JANUARY BAROMETER
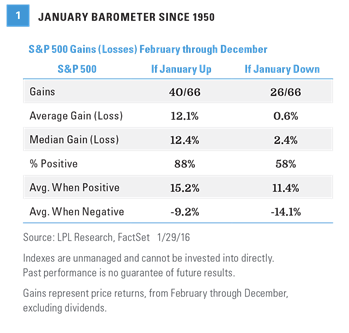
The widely followed January Barometer says, “As goes January, so goes the year.” In other words, if the S&P 500 is positive in January, stocks are likely to rise over the rest of the year; and conversely, if January is in the red, then the rest of the year will also be weak. With the S&P 500 down 5.1% in January, after being down as much as 9% for the month as of January 20, 2016, this indicator will likely get a lot of press over the next few days. Looking at the data does show the final 11 months of a calendar year tend to take a cue from January. Since 1950, January has been higher 40 times; and in those years, the average return the rest of the year has been 12% with additional gains posted 88% of the time. When January has been negative, the rest of the year has been flat on average but still posted gains 58% of the time [Figure 1].
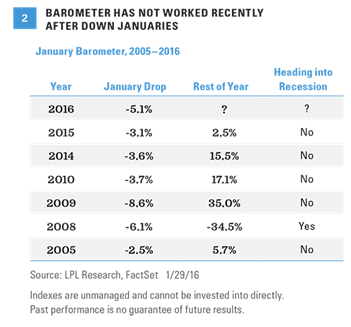
Recently though, this indicator hasn’t worked very well. The last four times the S&P 500 fell in January, stocks rose the rest of the year. In 2009, 2010, 2014, and 2015, the S&P 500 was red in January and each year saw a bounce back, by 35%, 17%, 15%, and 2%, respectively. Since 2005, the only year to see a decline after a January drop was 2008, the start of the financial crisis and Great Recession. Given we do not think the economy is headed for a recession this year, we maintain our base case view that stocks are likely to end 2016 higher than where they closed on Friday [Figure 2].
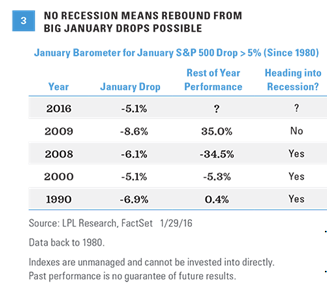
What about when January is down big (5% or more), like what occurred in January 2016? Again, distinguishing recessionary periods provides useful perspective. Looking at all years since 1980, when the economy was in a recession, the rest of the year was weak for stocks after a down January. When the economy was not in recession or emerging from one, as was the case in 2009, the rest of the year saw a big rally [Figure 3]. We are not suggesting 2016 is like 2009, but the economic environments in 1990, 2000, and 2008 bear little resemblance to 2016, suggesting to us that the backdrop for stocks is more supportive today.
PERSPECTIVE ON VOLATILITY
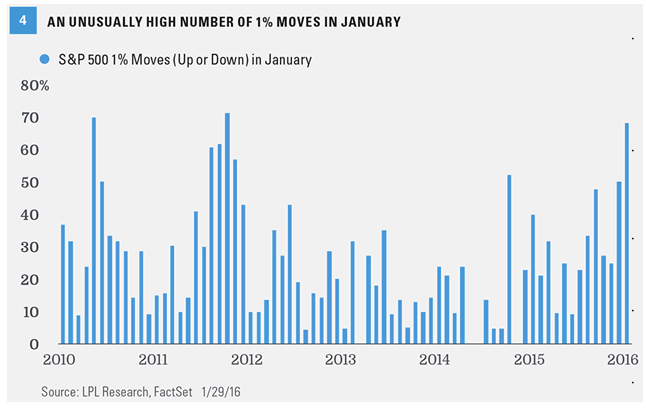
Not only were stocks down in January, but the month also brought significant volatility. In fact, 2016 saw the worst 10-day start to a year ever for the S&P 500, although stocks did manage gains during each of the last two weeks of January. In the end, 13 trading days out of 19 saw a 1% move (higher or lower), the most since October 2011 [Figure 4]. On a percentage basis, 68% of the days moved at least 1%. Since 2010, only May 2010 and October 2011 saw more daily volatility.
Unfortunately, this volatility may stay with us, given we are late in the economic cycle and the complex nature of the biggest factors weighing on investor sentiment. However, with the VIX measure of implied stock market volatility in-line with its long-term average at 20, and the maximum drawdown in the S&P 500 so far this year at 12%, we would continue to characterize the volatility we have seen thus far in 2016 as within a normal range.
KEYS TO A BETTER FEBRUARY
After last week’s bounce and two straight weeks of gains for the S&P 500, it is very tempting to wave the “all clear” flag. We have cited a number of positives for this market that may help drive a turnaround for stocks in the coming month, including:
· Few bulls remaining. Extreme bearish sentiment has reached levels that have tended to accompany market bottoms.
· More reasonable stock valuations following the latest correction. Valuations for the S&P 500, at 15 times forward earnings estimates and 16 times trailing earnings, are in-line with long-term averages and especially attractive considering low interest rate levels. Yields are also attractive at 2.3% for the S&P 500 compared to a 10-year Treasury yield at 1.9%.
· Low probability of recession. Despite lackluster gross domestic product (GDP) growth in the fourth quarter of 2015, we continue to see the probability that the U.S. economy enters recession in 2016 as low, potentially 15– 20% based on the economic data.
· Earnings acceleration is still likely in 2016. Our view and the consensus view are still calling for mid-single-digit earnings gains in 2016 as the energy and U.S. dollar drags abate. We do not believe the diversified broad market index needs much help from improved global growth to achieve these gains, despite the lackluster start to fourth quarter 2015 earnings season.
Fed communication may help. Federal Reserve (Fed) Chair Janet Yellen’s House testimony on February 10 may help stocks if the Fed’s communicated timetable for rate hikes this year (four) moves closer to the market’s view (zero to one).
· Potential for more stimulus from China and the Eurozone. The market reacted very positively to Friday’s (January 29, 2016) news that Japan was moving to a negative interest rate policy. Europe and China may follow with additional moves to help the market’s perception of future growth.
However, we still have some concerns that suggest a market tug-of-war in the near term:
· Alternatively, Fed communication may not help. Chair Yellen did not help assuage the market’s fears of an overly aggressive Fed or global growth risks in the Federal Open Market Committee (FOMC) statement on January 27, 2016, and may not do so when she speaks on February 10. With four hikes still on the table, the risk of a policy mistake and additional stock market volatility is higher.
· Oil markets have made very little progress toward balancing supply with demand. Reports of a Saudi Arabia–Russia agreement to cut oil production appear to lack substance. Oil markets have contributed to fears of a disruption in credit markets that may contribute to choking off financing even to non-energy companies.
· China may need to further devalue its currency. Until that happens, or unless China somehow convinces the market it doesn’t need to take such action (unlikely), we see risks of another potential downdraft in the U.S. stock market. China’s currency devaluation contributed to the stock market correction in August 2015.
· Fourth quarter 2015 earnings season has disappointed. Although we continue to expect earnings growth to increase over the course of 2016, the trajectory of that ramp has flattened out after the latest batch of disappointing results. Fourth quarter S&P 500 earnings are tracking below prior estimates, unusual at this stage of earnings season, and 2016 estimates have already been revised lower by more than 2% (to a 4–5% increase).
Also pointing to a better February is that the month has been higher each of the past six years, the only month to do so. Although February is one of only three months with a negative long-term average return, this month has seen some very positive seasonality recently. Additionally, the S&P 500, which fell in November and December 2015, has not fallen for three straight months since 2011. Finally, in 2010, 2014, and 2015, the S&P 500 dropped at least 3% in January, but saw February bounce back by 3%, 4%, and 5%, respectively.
Putting all of this together, we still believe stocks may produce modest gains in 2016, but in the short term, we see risks as balanced between upside and downside, which suggests some caution is warranted.
CONCLUSION
The January Barometer says that prospects for gains in the stock market are less likely for the final months of the year when stocks finish lower for the month of January. However, this indicator has not worked well in recent years, when down Januaries have led to strong Februaries, and annual returns have mostly been positive outside of recession. We still see opportunities in the stock market in 2016, but suggest caution in the near term as we await clarity on the key factors pressuring investor sentiment, including the Fed, China, and oil.