


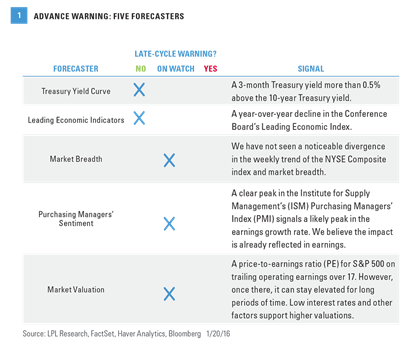
The Five Forecasters still favor the continuation of the current bull market and no recession. The Five Forecasters, which we first introduced in 2014, are five indicators that, collectively, have historically signaled the increasing fragility of the U.S. economy and a transition to the late stage of the economic cycle and an oncoming recession.
Currently, these indicators are generally sending mid-cycle signals (similar to our cycle clock from Outlook 2016). Three of the five indicators are flashing a warning signal and suggest the cycle may have moved past the midpoint, while two of them are still benign [Figure 1]. Here we review these five indicators, which still signal that this bull market may continue and that the latest S&P 500 correction may stop short of a 20% decline.
Bear market declines of 20% or more for stocks are not always accompanied by a recession, although more often than not, that is the case. Accordingly, we believe these indicators can be used to give some advance warning of an impending bear market. The average S&P 500 decline in a bear market historically is about 33%, compared to the 12% peak-to-trough decline from the all-time high on May 21, 2015, through January 20, 2016.
Leading Economic Indicators: No Warning
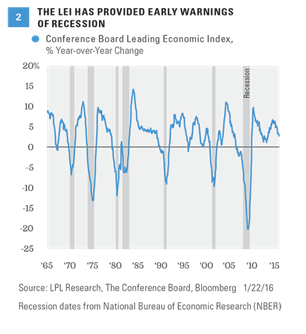
Among the Five Forecasters, the Conference Board’s Leading Economic Index (LEI) provides the best snapshot of the overall health of the economy. The LEI is an aggregate of 10 diverse economic indicators that have historically tended to lead changes in the level of economic activity. The index includes data on employment, manufacturing, housing, bond yields, the stock market, consumer expectations, and housing permits. Taken together, these indicators have a strong history of forecasting the path of the economy with a lead time of 6–12 months. The year-over-year change in the LEI has also provided an effective warning signal that the economy might be nearing a recession. When the year-over-year change has turned from positive to negative, on a year-over-year basis, a recession has followed in anywhere from 0–14 months with an average lead time of 6 months.
The year-over-year change in the LEI as of December 2015 was +2.7% [Figure 2]. Since 1960, when the LEI has been 2.7% or higher, the economy has been in recession for only one isolated month over its 672-month history, or 0.1% of the time, and the economy has entered recession in the next 12 months only 5% of the time. Even when the year-over-year change has been 2–4%, the economy has entered recession over the next 12 months less than 10% of the time. While the economy right now is showing a mix of early, mid, and late cycle signals, we agree, on balance, with the statistical evidence that the likelihood of a recession in the next year remains low.
Treasury Yield Curve: No Warning
Now that the Federal Reserve (Fed) has initiated the process of normalizing interest rates, some fear a recession may not be far behind. However, history shows that the start of rate hikes does not matter much to stocks after an initial dip and quick recovery. Instead, bull markets have historically ended (and bear markets have begun) when the Fed pushes short-term rates above long-term rates. This is referred to as “inverting the yield curve.” For example, the S&P 500 Index peaked in 2000 and 2007 when the 3-month to 10-year Treasury yield curve was inverted by about 0.5% (3-month Treasury yields were about 0.5% above the yield on the 10-year Treasury note).