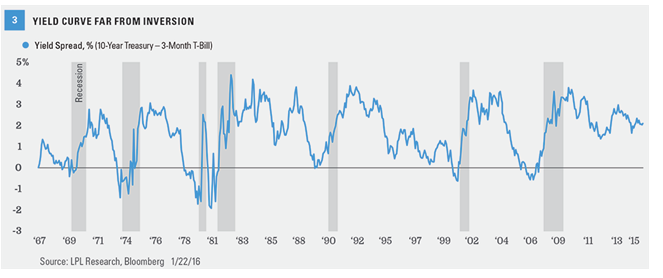
Why does an inverted yield curve signal a major peak for the stock market? Because every recession over the past 50 years was preceded by the Fed hiking rates enough to invert the yield curve. That is 7 out of 7 times—a perfect forecasting track record. The yield curve inversion usually takes place about 12 months before the start of the recession, but the lead time has ranged from about 5–16 months. The peak in the stock market comes around the time of the yield curve inversion, ahead of the recession and accompanying downturn in corporate profits.
With the 3-month Treasury and 10-year Treasury currently yielding 0.28% and 2.05%, respectively, the Fed must push up short-term rates by nearly 2.30% to invert the yield curve by 0.5%. Based on the latest internal Fed survey, the Fed does not expect to raise the fed funds rate above 3% until sometime in 2017, at the earliest. The facts suggest that one of the best indicators for the start of a bear market may still be a long way from signaling a cause for concern [Figure 3].
ISM Survey: On Watch
The Institute for Supply Management (ISM) Manufacturing Index has historically been a good earnings indicator. Earnings are the most fundamental driver of the stock market, and therefore, should be a part of any recession or bear market watch checklist. The ISM is an association of purchasing and supply management professionals who are surveyed each month to assess their future plans; the results of the survey are then used to create an index. Because purchasing managers are on the front line when it comes to the manufacturing supply chain, they can provide signals ahead of economic turning points. With about two-thirds of S&P 500 profits tied to manufacturing, manufactured goods demand has still been a timely barometer of all types of economic activity in recent decades.
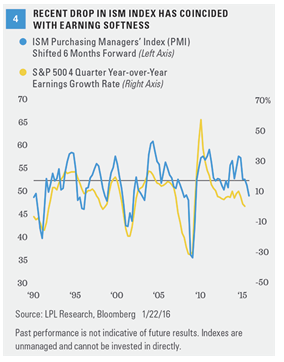
The ISM has a solid track record of forecasting earnings growth over the next 6 months [Figure 4]. A peak in the ISM, as occurred in late 2014, did indicate an ensuing slowdown in profits. Pulled down by energy sector weakness and a strong U.S. dollar, this indicator continues to signal an earnings lull and is one to watch closely. We believe the index may stabilize in early 2016 and that this period of earnings weakness will end up resembling the mid-cycle dips experienced in the mid-1980s, mid-1990s, and 2012, periods when the ISM dipped below 50 that were not followed by recession.
Market Breadth: On Watch
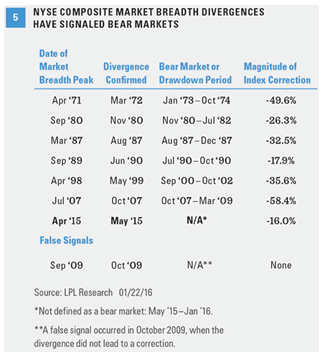
Analyzing market breadth has been a useful tool to help provide some advance warning of recessions and bear markets. We track market breadth by looking at the number of stocks that are advancing minus those that are declining. By tracking how many stocks are participating in a rally, or sell-off, we can get a sense of how broad and durable a rally may be. A market that is rising on the strength of fewer and fewer stocks is more vulnerable to a decline. If market breadth begins to decline and diverges from the rise in the NYSE Composite Index, and is followed by a decline in the index as it begins to succumb to the dwindling number of stocks in the index that are still rising, the likelihood of a major market downturn and recession increases (we use the NYSE Composite because of its many constituents).
Over the past 6 months, we have not seen a noticeable divergence in the weekly trends of the NYSE Composite Index and market breadth [Figure 5]; both patterns are moving in the same direction, downward. This indicates that both NYSE Composite Index prices and a large number of its constituents (breadth) have been moving lower during this time frame. We interpret the absence of a meaningful divergence between price and breadth prior to the current correction to mean that the stock market’s ascent in 2015 had a stronger foundation than it did ahead of prior recessions.