KEY TAKEAWAYS
· The LEI provides a valuable monthly guidepost regarding the state of the current economic expansion.
· Looking at past and present readings of the LEI provides added context for the potential direction of the U.S. economy.
· Despite a recent weak reading, we do not think the LEI is signaling a recession in the near term, although global and policy risks remain.
The Conference Board Leading Economic Index (LEI), one of our Five Forecasters, provides a valuable monthly guidepost regarding where we are in the economic expansion. The latest reading on the LEI, based on June 2016 data, revealed that the index climbed just 0.7% since June 2015. The month-over-month change in the LEI has been negative half the time over the past year, while the year-over-year change has decelerated from a high of 6.7% in July 2014 to the 0.7% today. This weakness has many observers concerned that the LEI is signaling a recession. In our view, the recent weakness in the LEI reflects the impact of the stronger dollar, the fall in oil prices and resulting decline in oil-related capital spending, and the general weakness in the manufacturing sector that has beset the U.S. economy since oil prices peaked in mid-2014. As we noted in our recent Midyear Outlook 2016: A Vote of Confidence, we expect many of those factors to fade in the second half of 2016.
WHAT DOES THE LEI REPRESENT?
The LEI is designed to project the probable path of the economy 6–12 months in the future. Since 1960, a span of 678 months (or 56 years and 5 months), the LEI’s year-over-year increase has been at least 0.7% (as it was in June 2016) in 487 months. Not surprisingly, the U.S. economy was not in a recession in any of those 487 months. Thus, the odds that the U.S. economy was in recession in June 2016 are close to zero. As we’ve noted in prior commentaries, when the economy has not been in a recession, the S&P 500 has been positive 82% of the time and provided low-double-digit returns. When the economy has been in a recession, the S&P 500 has been positive just 50% of the time, with average returns in the low-single-digits.
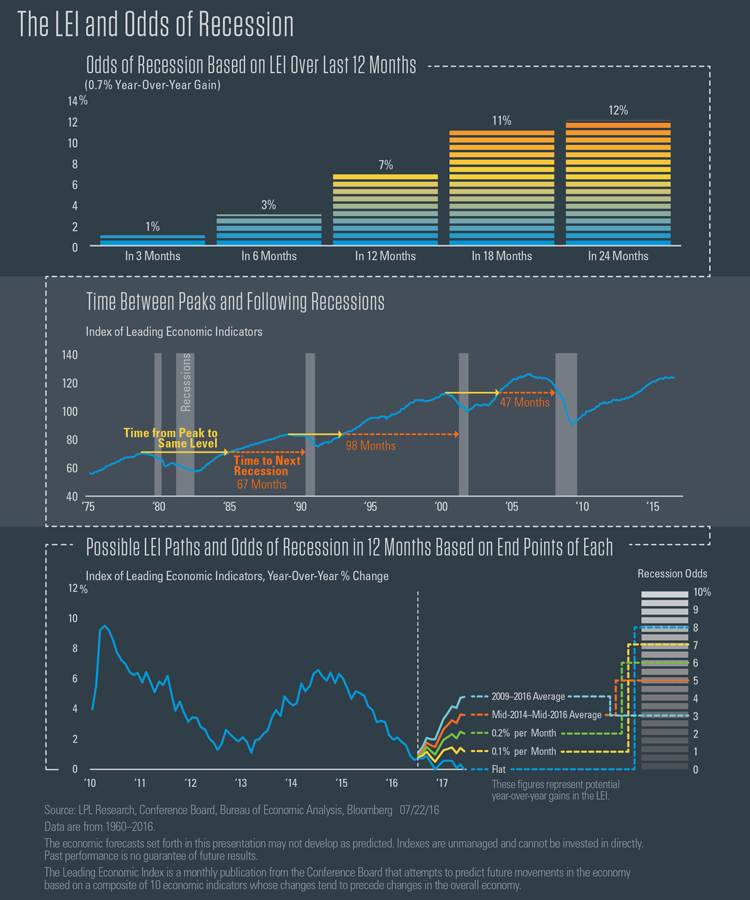
But the LEI is designed to forecast the potential direction of the U.S. economy and tell market participants what may happen, not what has already happened. Three months after each of the 487 months that the LEI was up 0.7% or more, the economy was in a recession just four times. Six months after the LEI was up by 0.7% or more on a year-over-year basis, the U.S. economy has been in a recession 12 times, or 3% of the time. Looking out 12 months after the LEI was up 0.7% or more, the economy was in a recession in just 33 of the 487 months, or 7% of the time. Based on this relationship, the odds of a recession within the next 18 months and 24 months are 11% and 12%, respectively [see the first chart in the infographic on page 3]; thus, despite the recent weakness in the LEI, the forward-looking economic indicators suggest that the odds of a recession in next few years are very low.
Another way to look at the LEI is by its level relative to its prior peak [the second chart shown in the infographic]. Sometime in the next several months, the level of the LEI may reach its prior peak (125.0), hit in March 2006. As is often the case when any indicator hits an all-time high or reaches a prior peak, this may raise concerns that a negative downturn is ahead, and in this case, that the economic cycle is nearing an end. But in fact, during the last three economic recoveries (commencing in 1982, 1991, and 2001), the recovery continued, on average, for another 6 years after the LEI hit its prior peak. During the 1982–1990 recovery, the LEI finally hit its prior peak in November 1984, and the economic expansion continued for another 67 months (nearly 7 years) before entering a recession in July 1990. During the 1991–2001 recovery, the LEI hit its prior peak in December 1992, and the economic expansion continued for another 98 months (more than 8 years) before entering a recession in February 2001. During the recovery that began in 2001, the LEI passed its prior peak in January 2004, almost 4 years before the Great Recession began in December 2007.
WHAT IS THE LEI SUGGESTING FOR WHAT'S AHEAD?