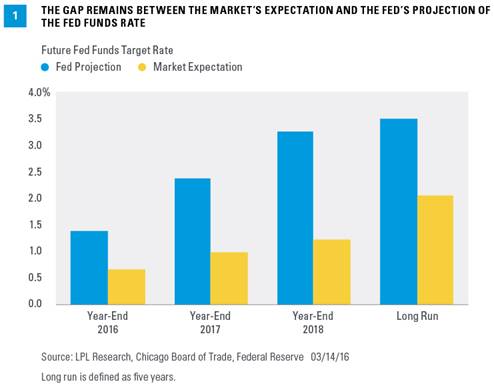
As the second of eight Federal Open Market Committee (FOMC) meetings of 2016 approaches later this week, the market and the Federal Reserve (Fed) remain deeply divided over the timing and pace of Fed rate hikes. The FOMC’s latest forecast of its own actions (December 2015) puts the fed funds rate at 1.375% by the end of 2016. As of March 14, 2016, the market (according to fed funds futures) puts the fed funds rate 0.50–0.75% lower than the Fed’s forecast, at around 0.67% by the end of 2016 [Figure 1], essentially pricing in just one more 25 basis point (0.25%) rate hike this year. How that gap closes—between what the market thinks the Fed will do and what the Fed is implying it will do—against the backdrop of what the Fed actually does, will be a key source of distraction for markets in 2016. Our view is that by the end of 2016, the fed funds rate will be pushed into the 0.75–1.0% range.
WHAT IS THE SCHEDULE OF EVENTS FOR THE FED THIS WEEK?
The Fed holds its second FOMC meeting of 2016 this Tuesday and Wednesday, March 15–16, 2016. The meeting will be followed by an FOMC statement at 2:00 p.m. ET on Wednesday March 16, along with the FOMC’s latest economic forecasts for gross domestic product (GDP), the unemployment rate, inflation, and fed funds projections for year-end 2016, 2017, 2018, and beyond (aka the “dot plots”). Following the release, at 2:30 p.m. ET, Fed Chair Janet Yellen will hold her first post-FOMC press conference of 2016.
HAS THE “MARKET” PRICED IN A RATE HIKE AT THIS WEEK’S MEETING?
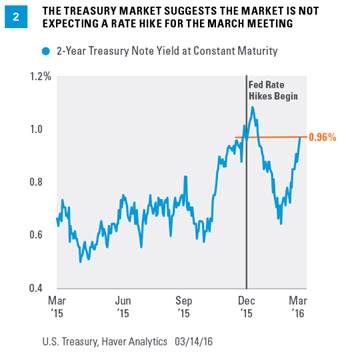
In short, no. As of Monday, March 14, the fed funds futures market has priced in just a 4% chance of a 25 basis point rate hike at this week’s meeting. Yields on the short end (as measured by the yield on the 2-year Treasury note) of the Treasury market—another good proxy for what the market is pricing in—have moved higher in the past month, from 0.65% in mid-February 2016 to 0.96% as of March 14. Taken out of context, that 0.30% increase in rates might indicate that the market expects a Fed rate hike at this week’s meeting. However, the volatile start to the year in financial markets drove the 2-year yield from 1.10% at year-end 2015 to as low as 0.65% in mid-February 2016; thus, at 0.96%, the 2-year yield is at the same level as just after the Fed hiked rates in mid-December 2015 [Figure 2].
WHY DO THE “DOT PLOTS” MATTER?
As noted earlier, the FOMC’s latest (December 2015) forecast of its own actions puts the fed funds rate at 1.375% by the end of 2016. As of March 14, the market (according to fed funds futures) puts the fed funds rate 0.50–0.75% lower at around 0.67% by the end of 2016. How this discrepancy resolves itself is crucial. Most market participants expect the FOMC to lower its year-end 2016, 2017, and 2018 fed funds target by at least 25 basis points (0.25%); this would mean that after this week’s meeting, the Fed would be looking for three 25 basis point rate hikes this year, not four. The market is split as to whether the FOMC will lower its forecast for the fed funds rate in the “long run” by 25 basis points to 3.0%. If the FOMC meets the market’s expectations and lowers the dot plots, this will help to close, but not completely eliminate, the gap between the market’s expectation and the Fed’s projection. We still think the Fed will maintain its insistence that any future rate hikes are “data dependent” and that every FOMC meeting in 2016 is a “live meeting.”
WILL THE ROTATION TO NEW FOMC MEMBERS IN 2016 IMPACT FED POLICY?
The FOMC consists of 19 members: 12 voting members and 7 nonvoting members. The 19 members are the presidents of each of the 12 regional Federal Reserve Banks (Boston, New York, Philadelphia, Richmond, etc.) and the 7 members of the Board of Governors of the Fed. The 7 board members include Fed Chair Yellen and Vice Chair Stanley Fischer.
At the start of 2016, the president of the Boston Fed, Eric Rosengren, a policy dove, replaced Richmond’s Jeffrey Lacker, a hawk (please see Figure 3 for a description of hawks and doves). Cleveland’s Loretta Mester replaced Chicago’s Charles Evans in a hawk-for-dove swap. The president of the St. Louis Fed, James Bullard, a hawk, replaced dove Dennis Lockhart (Atlanta) at the start of 2016, and Kansas City’s Esther George, who is also a hawk, replaced the dovish John Williams of San Francisco [Figure 3].
While the regional bank presidents that rotated onto the FOMC as voters at the start of 2016 are, in aggregate, more hawkish than the regional bank presidents who left, dissents are relatively rare, and the returning voting members of the Fed Board of Governors are likely to continue to vote with the chair and vice chair on monetary policy. Thus, even the net addition of perhaps two additional hawks to the FOMC in 2016 may not substantially alter the course of monetary policy this year.

DOES THE FED CHANGE MONETARY POLICY IN AN ELECTION YEAR?
The short answer is yes, despite misconceptions the Fed stands down before major elections. While the Fed often pauses in the month or so prior to the November election, the Fed has changed policy (either raised or lowered rates or stopped or started quantitative easing [QE]) in every election year since at least 1968, and we don’t expect anything different in 2016.
WILL THE ELEVATED VOLATILITY IN THE MARKETS DETER THE FOMC FROM RAISING RATES?
In general, the Fed as an institution and the individual members of the FOMC have a much higher threshold for financial market volatility than financial market participants, investors, and the financial media. There is no question that global financial markets have seen wild swings so far in 2016, with the S&P 500 falling 12% in the first few weeks of 2016, rallying by 7%, and retesting the lows of the year in mid-February 2016, before rallying 12% in the past month. Other markets (commodities, Treasuries, etc.) have seen similar swings.
Although the Fed clearly monitors activity in financial markets, it rarely, if ever, cites financial market weakness as a reason to change monetary policy. The FOMC statement released this week will probably acknowledge the recent market volatility, but keep it in perspective, and will likely point out that recent data on the labor market have been solid and inflation expectations — a key metric for the Fed — have stabilized despite the recent drop in oil.
Instead, the Fed typically focuses on financial conditions. There are several measures of financial conditions, or financial stress, tracked by the Fed. Figure 4 shows the Cleveland Fed’s measure of financial stress, which is a coincident indicator of systemic stress where a high value indicates high systemic banking stress. It aggregates stress levels in equity, credit, foreign exchange (currency), interbank lending, real estate, and the securitization markets. Over time, a rising level of stress indicates tightening financial conditions.
While financial stress has ebbed in the past few weeks, the stress level remains elevated from where it started the year, and, perhaps more importantly, where it was just after the Fed raised rates in mid-December 2015. Said another way, the financial market itself has done the Fed’s job of “tightening policy” and slowing the economy over the past three months or so. However, if financial stresses continue to fade, as they have over the past few weeks, we would expect the Fed to continue to tighten policy the old fashioned way—via higher interest rates—potentially as soon as the April 26–27, 2016 FOMC meeting.

John Canally is chief economic strategist for LPL Financial.