 The TV buzzes on in the living room. Pre-match pundits detail starting line-ups. You press open the microwave and gingerly remove a bag of popcorn. Beer foam bubbles out of a hand-chilling bottle. Dashing to the sofa, you are just in time to witness the first touches. Rooney kicks off. The Manchester United match is underway.
Now, we are not taking sides. Manchester United is but one example of a massively successful global sports team. Training kits and shirts struck in the infamous red and white are as popular in Kuala Lumpur as they are in Riyadh. Fans around the world huddle in smoky bars, craning their necks over friends’ shoulders to catch a glimpse of the action.
Manchester United is also one of the few global sports brands under public ownership, precisely why we’ve chosen to inspect it closely. For the many who wonder about the business of sports, for those curious about just how profitable such a ubiquitous sports brand actually is, we have some answers.
Like other elite sports franchises (read: Real Madrid), Man U’s financials tell of the profound impact wrought by globalization and digitization. No longer are packed stadiums the driver of sports profits. Top performing sports teams capture massive gains from global sponsorship and broadcasting agreements, attract the best players from around the world, and reach fans everywhere on screens big and small. Few business models look as promising as those of great sports teams in the 21st century.
Money Machine
Manchester United runs a profitable enterprise that pulls in significant revenue. In 2014, the team generated £433 million in sales. Of those sales, the club booked almost 15% as operating profit (for a total of £61 million). By way of rough example, that means for every £60 you spend on a shirt, £9 comes in as profit.
The football club breaks its revenues into three primary streams: commercial, broadcasting, and matchday. Commercial revenues (44% of the total) are from sponsorship agreements, merchandising agreements, and team tours. Broadcasting revenue (31%) is the result of media rights the club owns to televise Premier (2/3 of broadcasting revenue) and Champions League matches (1/3 of broadcasting revenue).
Finally, the club earns matchday revenue (25%). Just as it sounds, this is the money made at the so-called Theatre of Dreams (Old Trafford Stadium’s sobriquet) on match days. Manchester United also gets a cut of “gate receipts” from other cup matches, even when it plays away from home.
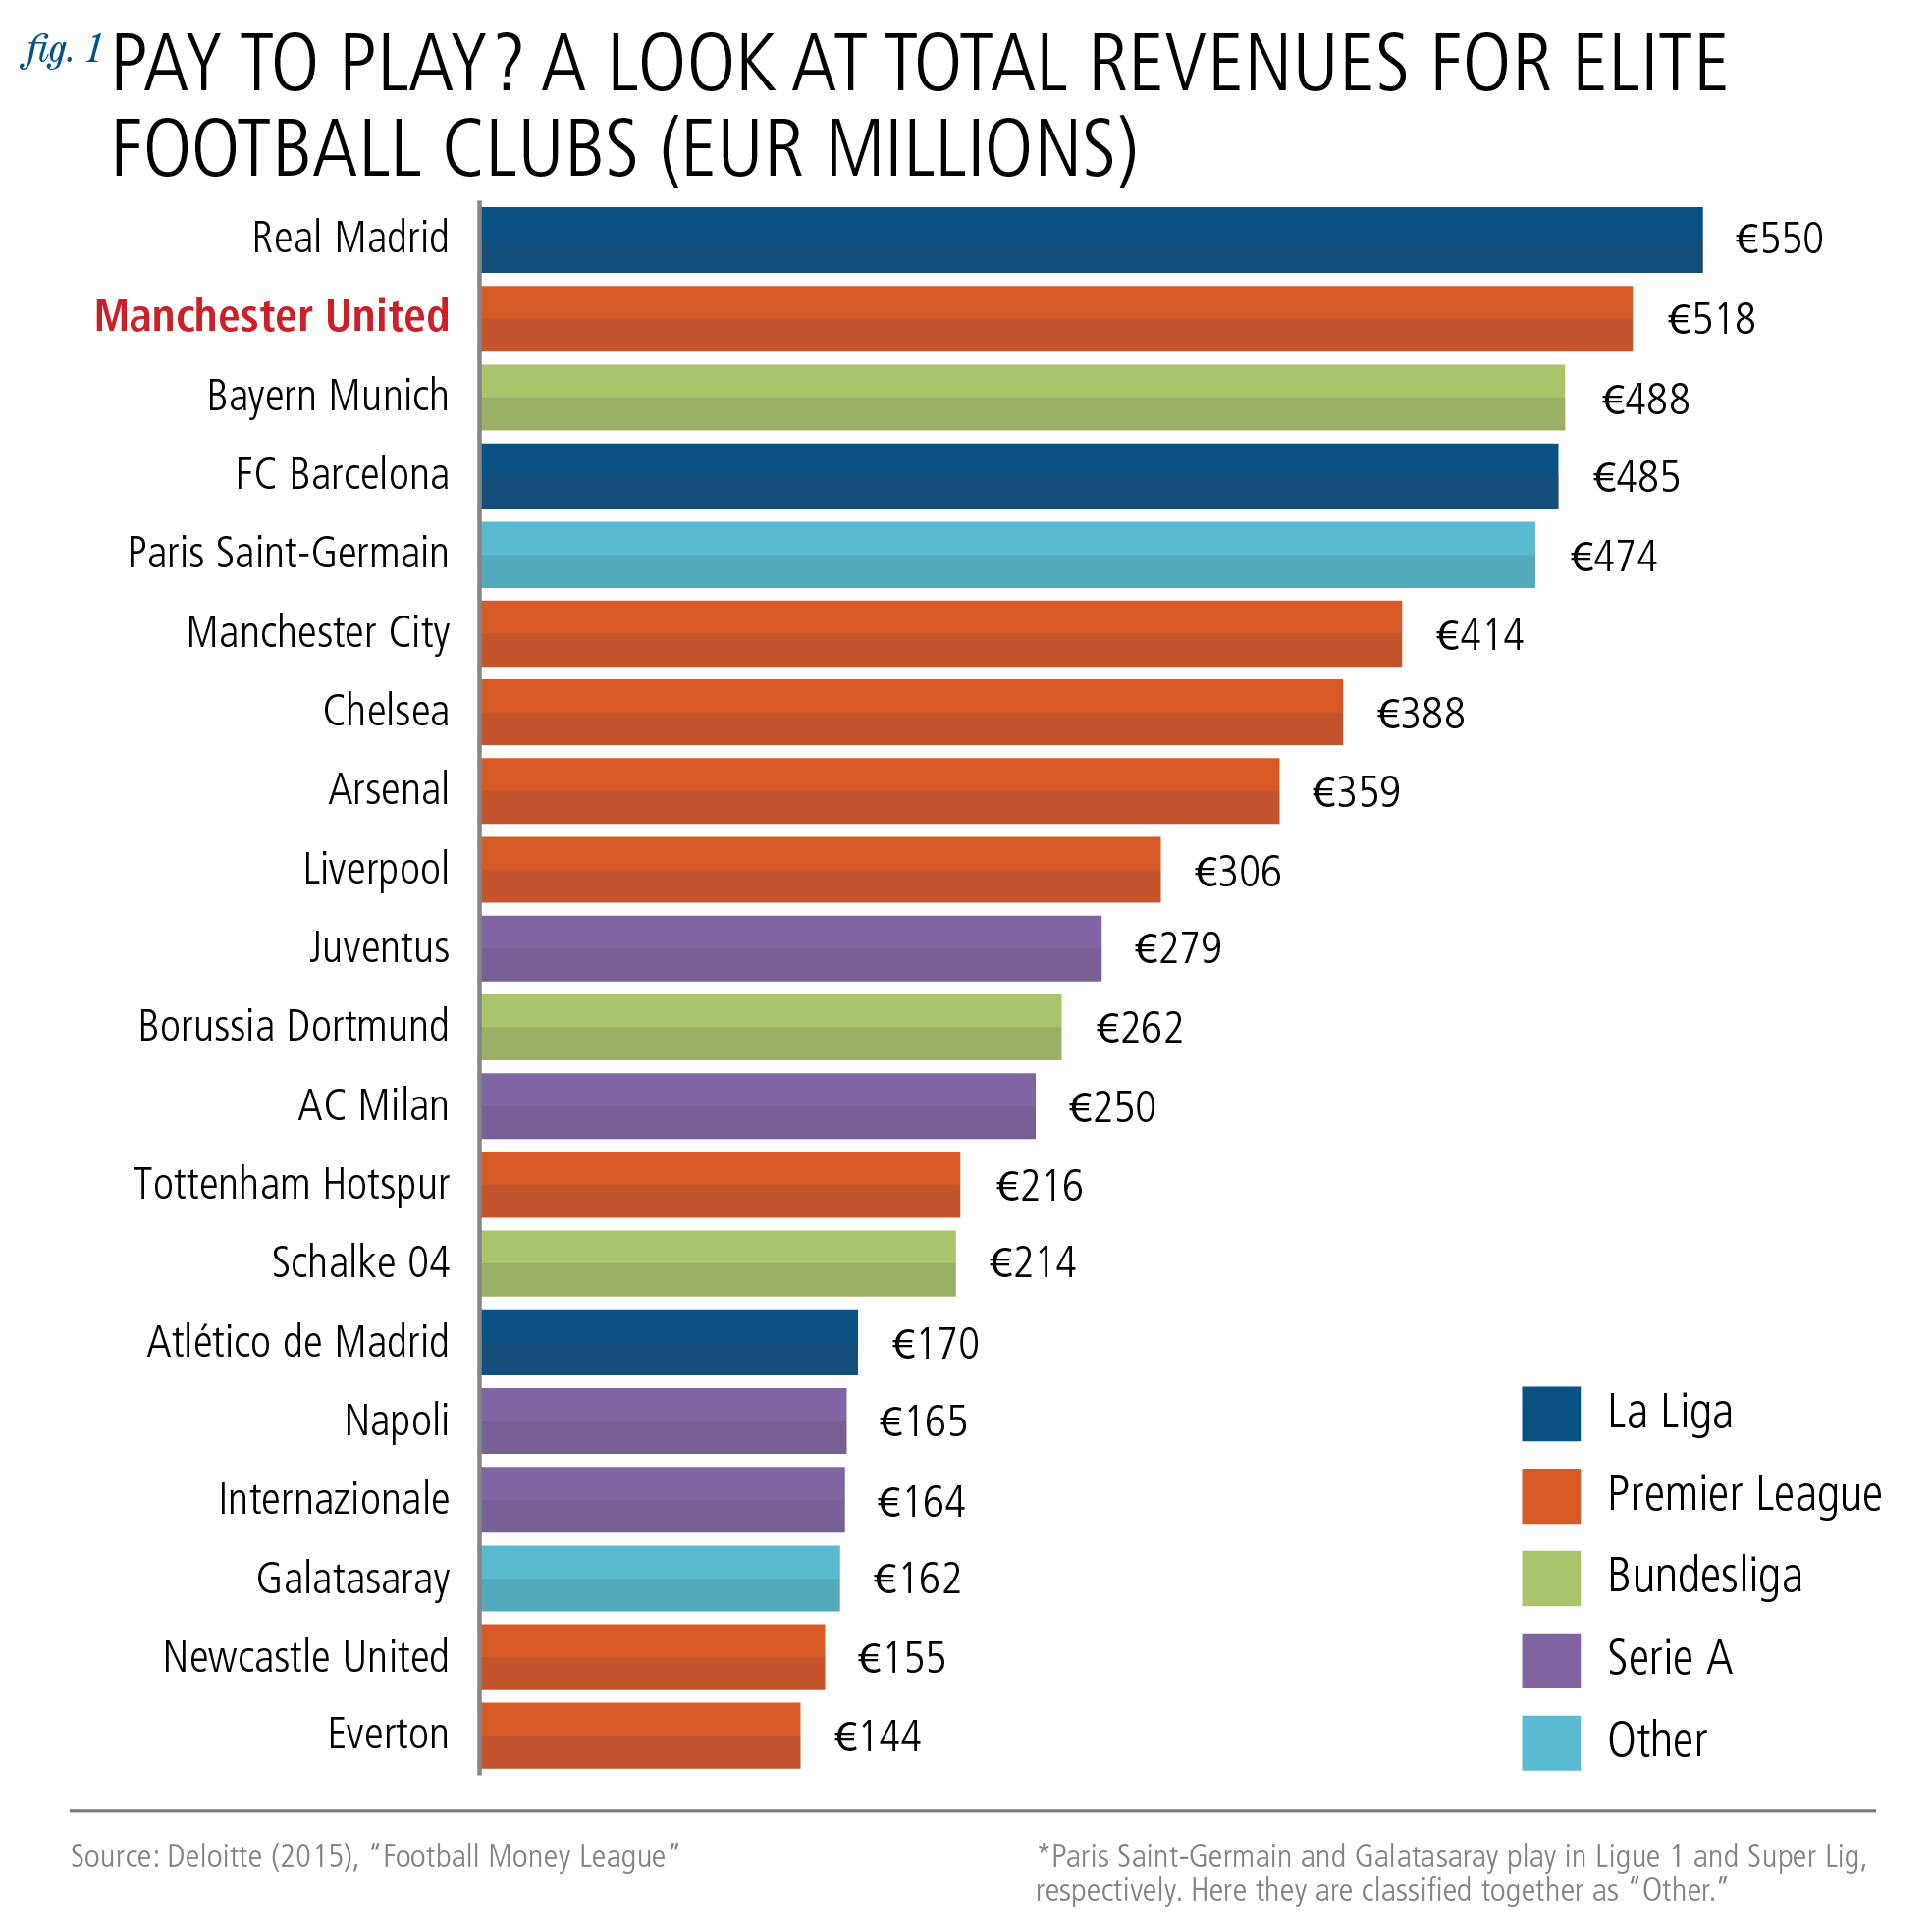
2014 was a rough year for Manchester United. They finished seventh in the Premier League. Remarkably, though, despite their less-than-stellar performance, the club was still the world’s second largest revenue generating football squad (see Figure 1). Consider that FC Barcelona claimed first place in its league twice in the last four years and still collected less revenue than Manchester United.
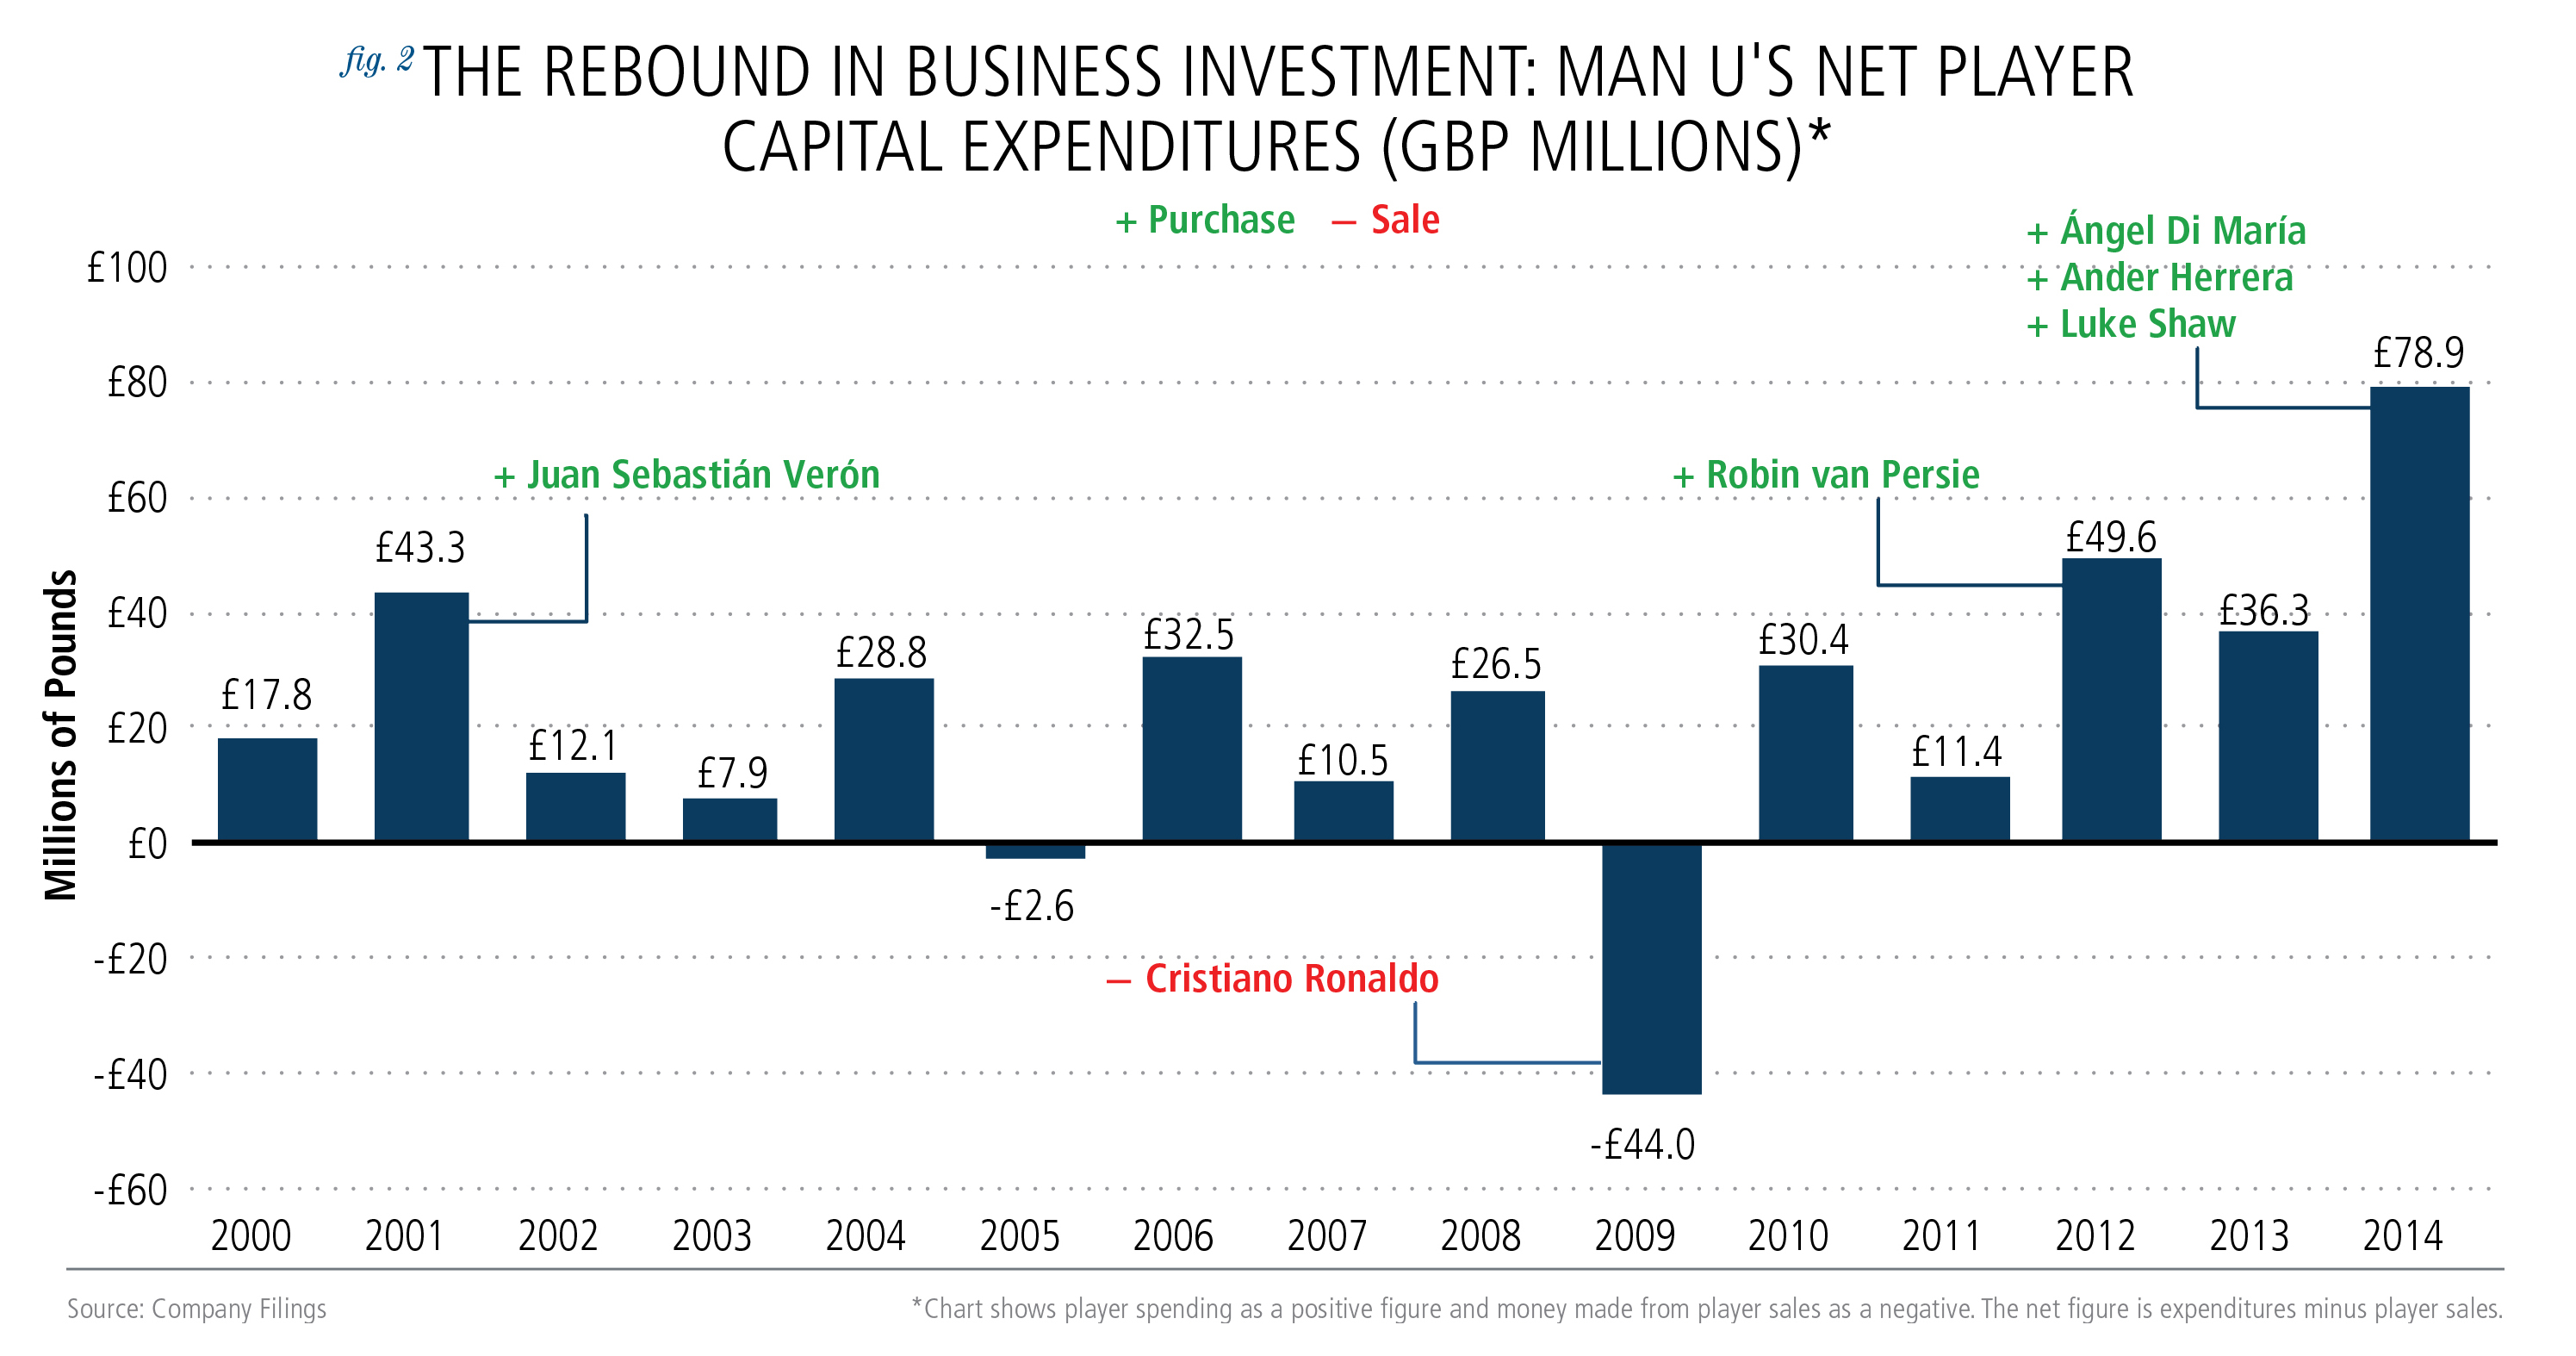
What about those player expenses? Employee benefit expenses were fully 50% of total revenues, costing the club £215 million in 2014. New joiners (Ángel Di María, Ander Herrera, and Luke Shaw) brought player costs up 19% in 2014 (see Figure 2). Not only does the club have to pay salaries to these prized players, it also must pay transfer fees—the cost of buying a player out of his prior contract. Transfer fees owed by Manchester United to other teams total just shy of £120 million as of December 2014. Talk about wage growth!
Going Global
The key to Man U’s revenue generation is their global presence. As wealth rises around the world, internet access and television broadcasting will increase. The clubs with recognizable brands are those that stand to earn the most.
Manchester United exemplifies the benefits of globalization. In 1987, matchday revenue accounted for 65% of Manchester United’s total revenue. By 2014, it was only 25% of total revenue (see Figure 3). Note that matchday revenue increased from £4.2 million to £108.8 million since 1987. Matchday revenue’s shrinking share of the total was due to revenue growth in other areas like commercial revenue.

The commercial revenue segment also bears the happy mark of globalization. This segment includes sponsorships, merchandising, and team tours. Where Vodafone once paid an average of £8 million per year to appear on every United shirt, in 2014 Chevrolet agreed to pay the club an average of £44 million per year to appear on the club’s shirts, despite Man U’s disappointing 7th place finish (see Figure 4). And German boot (cleat) maker Adidas recently dropped £750 million over ten years (£75 million/year) to be the official technical sponsor of Manchester United—a sum only £40 million less than the club itself cost its new owners in 2005.

The globalization of sport has wrought changes on the top football clubs across Europe beyond lucrative endorsements and sponsorships. In 1980, Manchester United’s roster was disproportionately from the United Kingdom–25 of 26 players. In 2014, things looked a bit different. Roughly 1/2 of the team’s roster was from outside of the UK. Across the Premier League, the data show the same. The best players in the world now come to play for the best teams in the world.
The 90th Minute
Internationalization is a good thing. Markets for footballers have become more competitive, and the chances that otherwise undiscovered, far flung football talent finds its way to the pitch at Old Trafford are as good as ever.
Fans and supporters benefit, too. English Premier League matches were broadcast live to over 200 countries in 2009.
With this walk through the finances of one of the world’s most prominent teams we hope you have a better sense of how globalization and digitization have turbo-charged elite sports franchises. Organizations producing high-demand, live content are among those best positioned to thrive in the condensed, interconnected, informational 21st century.
Peter Beer is a vice president and economist at Payden & Rygel. As part of the economics team, he is responsible for researching and developing views on the US and global economy. In particular, his research focuses on flows of funds, the global banking system, the US housing market, credit cycles, and economic history.