This Tuesday, February 2, 2016, is Groundhog Day. In Punxsutawney, PA, a groundhog named Phil either will or will not see his shadow and we’ll either be doomed to repeat the first six weeks of winter again (which haven’t been that bad in Boston at least) or have an early spring. Groundhog Day enthusiasts claim that the climate predictions made by Phil the Groundhog (and his “cousins” across the country) are accurate 75 – 90% of the time. The United States National Climatic Data Center (NCDC), the keeper of all weather statistics for the federal government, stated, “The groundhog has shown no talent for predicting the arrival of spring, especially in recent years.”
In recent weeks, there have been plenty of “groundhogs” in the financial markets and in the financial media. For some investors, the fear is that the market’s performance in January 2016 will be repeated over and over again, as in the classic 1993 film Groundhog Day starring Bill Murray and Andie MacDowell. Other investors fear that 1998 will play out all over again, triggered by central bankers’ policy mistakes, volatile currency markets, wave after wave of currency devaluations, and eventually a sovereign default. Another group of Groundhog Day aficionados think that the drop in oil, the rising U.S. dollar, a lack of corporate earnings growth, a manufacturing recession, a hard landing in China, and global central banks “running out of bullets” have returned the global economy to the precipice of another 2008.
WHICH IS IT? JANUARY 2016? 1998? 2008? ALL OF THE ABOVE? OR NONE OF THE ABOVE?
While our view is that the odds of a U.S. recession in 2016 have increased in recent weeks, based on the economic data alone, the odds of a recession in the U.S. remain low, potentially 15 – 20%. However, the odds of a policy mistake — either at home, or more likely, abroad, by central bankers or central governments enacting fiscal or foreign exchange policies — have increased in the first month of 2016. In terms of volatility, a repeat of 1998 is a possibility. That year saw a 20% peak-to-trough decline in the S&P 500 amid a wave of currency fluctuations, devaluations, and ultimately a default by Russia; but our view remains that the S&P 500 will post modest mid-single-digit returns in 2016,* not the near 30% gain seen in 1998.
How about the volatility and price declines in January 2016 repeating in every month for the rest of the year? This possibility has higher odds than a repeat of 1998, and while we do continue to expect elevated economic and financial market volatility in 2016, a repeat of the volatility seen in January 2016 is unlikely (based on historic volatility of the S&P 500).
And that leaves a repeat of 2008. Let’s review from the perspective of the U.S. consumer, who today, as in 2007, accounts for about two-thirds of economic activity in the United States.
*Historically since WWII, the average annual gain on stocks has been 7 – 9%. Thus, our forecast is roughly in-line with average stock market growth. We forecast a mid-single-digit gain, including dividends, for U.S. stocks in 2016 as measured by the S&P 500. This gain is derived from earnings per share (EPS) for S&P 500 companies assuming mid- to high-single-digit earnings gains, and a largely stable price-to-earnings ratio (PE). Earnings gains are supported by our expectation of improved global economic growth and stable profit margins in 2016.
CONSUMER GROUNDHOG DAY? 2007 VS. 2016
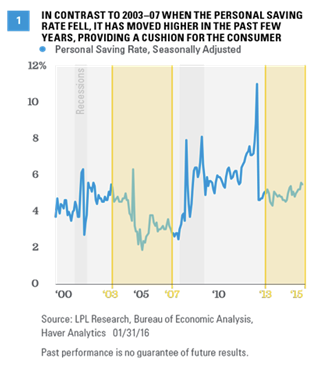
By 2007, a year had passed since the Federal Reserve (Fed) had completed a two-year, 425 basis point (4.25%) rate hike regime in mid-2006, inverting the yield curve and driving the rate on a 30-year fixed mortgage from 5.25% in late 2003 to over 6.75%. Other consumer loan rates moved up along with mortgage rates as well, further burdening already overburdened consumers, who generally hadn’t repaired their balance sheets after the 2001 recession. The personal saving rate dipped from close to 6% in 2004 to under 3% by the end of 2007 [Figure 1].
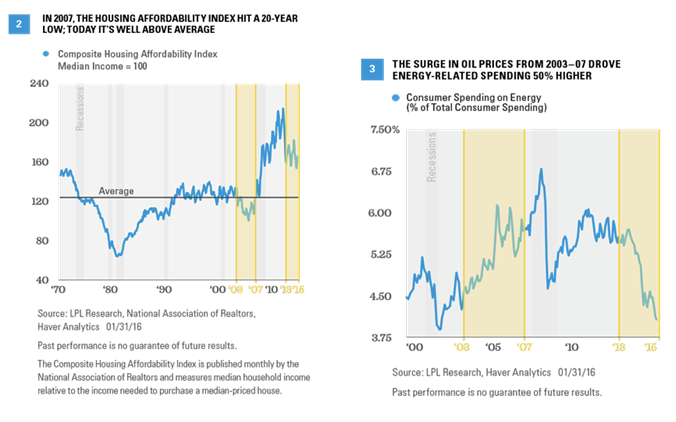
In 2007, the rise in mortgage rates, a sharp rise in home prices, and stagnant incomes drove the housing affordability index to a 20-year low [Figure 2]. Although unclear at the time, the housing market had peaked in mid-2006; and by 2007, inventories of unsold homes were surging to near record highs. If the rise in mortgage rates and the crushing level of housing debt rung up during the housing boom wasn’t bad enough for consumers, oil prices moved from around $30 per barrel in 2003 to near $100 per barrel by late 2007, driving consumer spending on energy-related goods and services 50% higher [Figure 3]. Add in tepid real wage and job growth, and the U.S. consumer was already reeling by the time the worst of the financial crisis hit in late 2008, freezing up global credit markets for months and virtually halting global trade and economic activity.
Today, consumers have spent the past six and a half years repairing their balance sheets [Figure 4], oil prices have dropped by nearly 60%, and consumer spending on energy and energy services have been cut by 50% over the past five years. Yes, the Fed has raised rates by 25 basis points (0.25%), but that’s a far cry from the 425 of 2004 through 2006. The yield curve remains positively sloped and mortgage rates are under 4%, nearly 2.5% below their mid-2007 levels. Housing prices are up, but this time they are rising in-line with consumer incomes, not outpacing them, and inventories of new and unsold homes are close to all-time lows. Housing affordability, while not at all-time highs, remains well above average [Figure 5].
Although nominal wage growth is tepid as it was in 2007, real wages (wage growth adjusted for inflation) are running well above levels seen in 2007, thanks mostly to the drop in energy prices. The personal saving rate stands close to 6%, nearly double what it was in late 2007, and it has moved steadily higher, not lower, in the past few years. And while U.S. and global financial institutions aren’t in perfect shape here in early 2016, safeguards imposed by financial regulation have kept them strong, albeit with some unintended consequences in the bond market.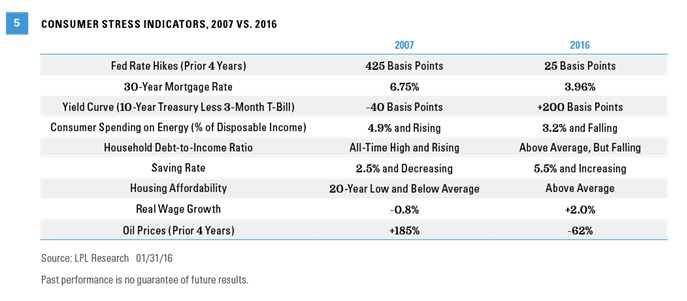
It is hard to argue that the global financial system isn’t better off today compared to 2007. In short, the U.S. consumer — two-thirds of the world’s largest economy — is in far better shape today in almost every respect than it was in 2007, just prior to the onset of the worst of the Great Recession in 2008.
A GLOBAL GROUNDHOG DAY?
While the odds of recession in the U.S. have increased this year, along with the odds of a mistake by global policy makers as they navigate slow global growth, a downshift in Chinese economic growth, shifting foreign exchange rates, and a seemingly unending race by global central banks to find new ways to stimulate economic activity, we think a global Groundhog Day — a repeat of January 2016, 1998, or 2008 — is unlikely. However, we continue to expect more financial market and global economic volatility in 2016, as economies and policymakers continue to adjust to the unique challenges of the current economic cycle.
John Canally is chief economic strategist for LPL Financial.