


A fourth way to look at home pricing is to look at home pricing relative to the cost of construction - a sort of price-to-book ratio for the housing market. The price of any home can be divided into two separate components - what it would cost to rebuild the house itself from scratch, and the implied value of the land on which it is located. Ongoing work conducted by the Lincoln Institute of Land Policy and the University of Wisconsin decomposes the value of U.S. housing into these two pieces3. On average, since 1975, U.S. residential real estate has been worth about 55% more than the cost of rebuilding it - that is to say, land has represented about a third of the total value of residential property. In the housing boom, home prices rose much faster than construction costs so that by the middle of 2005, the value of houses was implicitly twice what it cost to build them, as is shown in the chart below.
Of course, this was tremendously encouraging to builders, since, if they could get their hands on a piece of vacant land at any reasonable price and put up a house, they could walk away with a healthy profit.
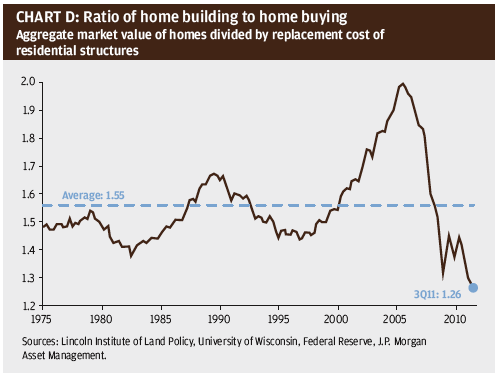
Since then, like practically every other number in the housing market, the implicit value of land has plummeted, even as the costs of labor, cement, lumber, and so on have risen. Consequently, by the third quarter of 2011, the estimated value of the U.S. housing stock was only 26% higher than the cost of constructing it4. In some metropolitan areas, existing home prices have fallen so much relative to construction costs that building, rather than buying, would only seem logical if the land could be bought for close to nothing.
While this is a big part of the reason why home building has ground to a halt in many metropolitan areas, it should be somewhat comforting for current home buyers and home owners. Given that builders can't actually buy land for a song, in many cities, home prices will have to rise before there is any significant increase in supply.
Supply, Demand And Inventories
On a variety of measures, U.S. home prices look very low. This, in itself, does not guarantee that they are about to turn. However, trends in supply, demand and inventories strongly point to rising home prices in the years ahead.
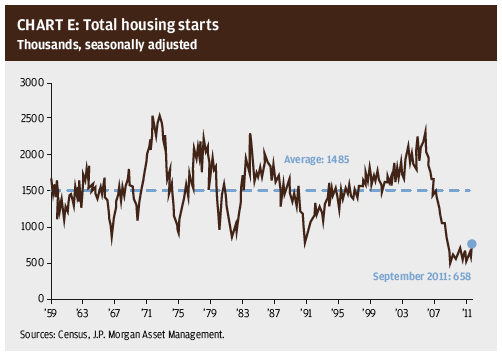
First, on the supply side, the great housing bust of the late 2000s has reduced home building to a shadow of its former self. Perhaps the most dramatic statistic is illustrated in the chart to the right, which shows total U.S. housing starts at a seasonally adjusted annual rate from 1959 to today. Prior to 2008, there had not been a single month in almost 50 years when housing starts had fallen below 798,000. Since the start of 2009, there has not been a single month where starts have exceeded 687,000.
This extraordinarily low rate of construction looks even more dramatic when normal housing depreciation is considered. Over the past decade, the total stock of housing in the United States has risen by 13.5 million units. However, we know that 15.4 million homes have been completed, so a net 1.9 million units, or 190,000 per year, have been destroyed by fire, natural disasters, and so on. Given this, the current construction rate of roughly 575,000 units per year implies an annual increase in the housing stock of just 385,000 units.
On the demand side, normal demographic trends should still be building pent-up demand. In the last decade from 2000 to 2009, the U.S. population grew by an average of 2.8 million people per year, with natural population growth contributing approximately 1.7 million people and immigration adding about one million. In addition, over the same period, an average of 2.2 million couples got married each year. All of these numbers have fallen somewhat in the recession of 2008-2009 and its aftermath, as couples have postponed marriage, families have postponed having children, and immigration has been discouraged by the lack of jobs. However, even if births, immigration and marriages have all been depressed by the slow economy, they all likely still imply a much stronger pace of home building than currently exists.
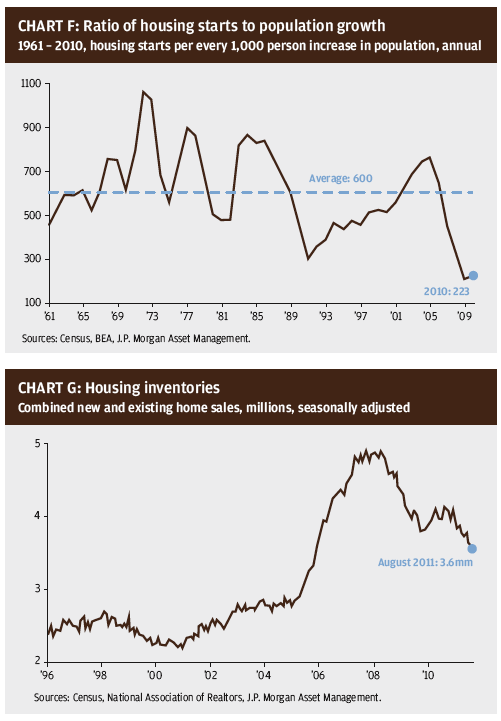
The top chart to the left shows the relationship between annual population growth and housing starts over the past 50 years. While home-building numbers are much more volatile than demographic ones, on average over this period, the U.S. has seen 600 homes started for every 1,000 person increase in the population, or a ratio of 0.6 homes per person. Given estimated population growth of 2.46 million people in the 12 months ending in August 2011, this relationship today would suggest total housing starts of 1.4 million units compared to the 572,000 starts that actually occurred6. Moreover, it is also worth noting that at least when it comes to marriages and births, decisions to postpone may also be generating a pent-up demand, which will be expressed as the economy gradually improves.
Given these statistics on supply and demand, it seems almost inevitable that the inventory of unsold homes must be falling. It is - but it still has a long way to go.
The bottom chart to the left shows the total number of new and existing homes for sale in the United States from 1996 to today. From the mid 1990s to the mid 2000s the number was fairly steady at about 2.5 million units. However, as the housing bubble grew, so did the pace of home building, which naturally outstripped the demographic growth in demand; by the summer of 2007, the total number of homes on the market peaked at just under 5 million units.
Since then, inventories have been on a painfully slow drift downward as a drop in demand offset much of the impact of the collapse in home building. However, by August of this year, combined new and existing homes listed for sale had fallen to 3.6 million units, having completed roughly 70% of the journey back to normal.
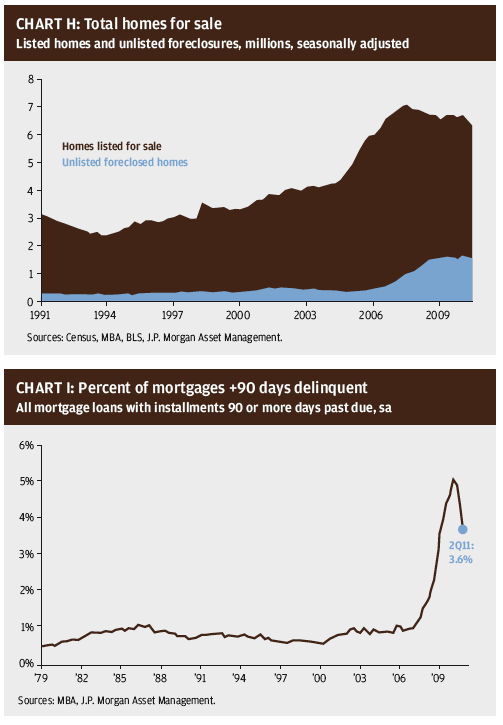
Many have argued correctly that even this excessive level of inventories understates the problem, as there are millions of homes today in foreclosure that are not yet listed as being for sale. Data from the Mortgage Bankers Association can be used to estimate the number of homes in foreclosure, which today stands at roughly 2.2 million units7. It is estimated that approximately a third of these are in fact listed for sale, so adding unlisted foreclosures to the number of homes actually listed for sale boosts the inventory of homes for sale, as well as diminishes the progress made in cutting into this during the past four years.
Some further argue that the problem of foreclosures will only get worse, as there is a backlog of pending foreclosures that is being suppressed by litigation and legislation aimed at preventing foreclosures. However, while such a backlog may well exist, it should be noted that mortgages issued since the bursting of the housing bubble are much less problematic, and that the percentage of mortgages 90 days+ delinquent (a reliable precursor to foreclosure) is actually falling.
Housing Market Attitudes
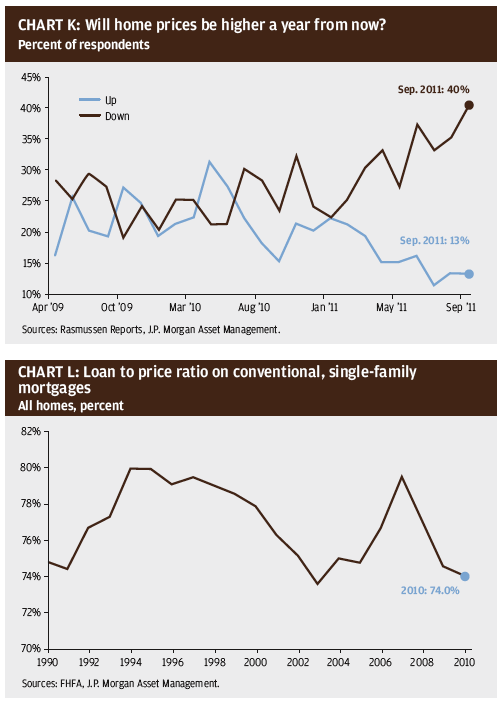
Given all of this, why have home prices not already begun to recover? Part of the problem is simply one of attitudes and expectations. In a recent poll8, just 13% of Americans expected the price of their home to go up in the next year, and just 36% thought it would go up over then next five. Unfortunately, this poll wasn't conducted prior to 2009. However, a similar survey in 2006 showed that fully 81% expected the value of their home to increase in the future9.
The attitude of lenders is also a barrier. While the wild-west lending standards of the mid 2000s undoubtedly fueled the housing bubble, in its aftermath, banks have become very cautious. This can be seen in the chart on the bottom left, which looks at the loan to price ratio on conventional, single-family mortgages since 1990. This ratio has fallen sharply since its 2007 peak, reflecting the reluctance of banks to make loans on the scale that they had during the housing bubble.
A heavy overhang of foreclosures is a reminder of the dangers of easy lending, and a waft of litigation associated with foreclosures is, not surprisingly, limiting the desire of banks to lend to anyone who might, in the future, default. New regulations are reducing bank profitability in certain areas, forcing banks to raise capital, and generating uncertainty about business conditions for banks in the years ahead. Finally, the Federal Reserve's policy of reducing longterm interest rates, while making mortgages more attractive to borrowers, are also making them much less attractive to lenders by squeezing net interest margins and increasing the risk of loss once the Federal Reserve finally allows long rates to rise.