The 10-year Treasury yield has fallen by 0.6% over the past six weeks, a very rare occurrence. Going back 20 years, such a noteworthy yield decline over such a short period of time has occurred only 2% of the time since February 1996. Figure 1 illustrates not only the rarity of such large yield declines, but also the significant events that pushed high-quality bond prices higher and yields lower. Recessions or global crises are the most frequent catalyst, although the current episode has no single driver. China growth fears, oil prices, sluggish U.S. economic growth, and most recently, bank credit fears, have each played a role in driving Treasury strength.
Recssion Warning…
…But Not Fool Proof
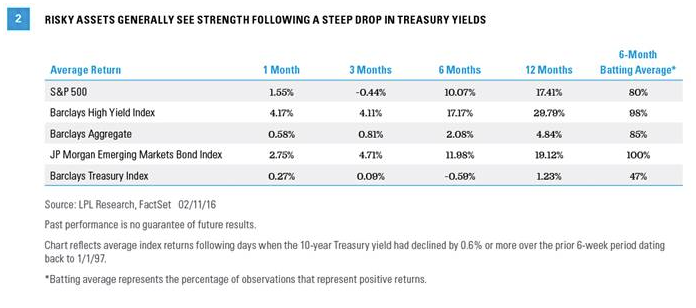
1) Periods of extreme Treasury gains do not necessarily reverse over the short term. Performance slows but remains positive over subsequent 1- and 3-month periods [Figure 2]. So even though Treasury strength is extreme, high-quality bonds generally hold onto the gains over the short term.
2) Over the longer 6- to 12-month time frame, risk assets or more economically sensitive sectors, such as stocks, high-yield bonds, and emerging markets debt, generally recover. Over the short term, stocks show an initial bounce; but over the 3-month period, returns are slightly negative, meaning that challenges linger even after an extreme decline in Treasury yields.
While risk assets struggle initially, 6- and 12-month time periods are clearly more favorable, and also indicate a high probability of a positive return (denoted by “batting average,” the percentage of observations that represent positive returns). Based on these observations, it would appear that market sentiment takes some time to turn, but when it does, the returns are generally positive, and can be quite strong.
Treasury prices exhibit the opposite behavior, showing continued strength (and lower yields) in the short term, while returns become negative as yields rise over the 6-month time period. Batting averages do not show the same consistency as risk assets, with positive returns 47% of the time over the 6-month horizon.
One additional point to be aware of is that 32 of the 100 days that saw steep Treasury yield declines occurred during the financial crisis. Taking into account the lower level of yields today, only 2011 and 2008 saw larger relative drops in the 10-year yield; however, performance following such drops was similar, with risk assets outperforming their lower-risk counterparts over the following 6- and 12-month horizons.
Oncoming recessions have triggered big Treasury yield declines in the past. The largest drop in the 10-year yield over the last 20 years (which maxed out at a drop of 1.75% between November and December 2007) came, no surprise, in the run-up to the financial crisis. Another significant decline occurred in the lead-up to the technology bubble of 2000, the terrorist attacks of 2001, and the subsequent recession. In both cases, Federal Reserve (Fed) rate cuts added momentum to Treasury gains.
However, a significant drop in Treasury yields is not, on its own, a good leading indicator for recession. As Figure 1 also illustrates, high-quality bonds saw bursts of robust gains and yield declines on several other occasions that did not precede or accompany recessions.
However, most Treasury yield declines did happen during periods of equity market weakness; and, on average, equity markets dropped 13% during the 3 months prior to a 10-year yield decline of at least 0.6%. Markets witnessed gains in the preceding 3 months in only 9% of cases, showing that a pullback in equity markets, and subsequent buying of high-quality assets such as Treasuries, was the driver of the large drop in yields. This time is no exception; the S&P 500 has fallen nearly 12% over the past 3 months—in keeping with the historical pattern.
It's Darkest Before Dawn
While it is good to know what types of events can cause steep declines in Treasury yields, it’s more important to determine what such a drop means for the future. The record over the last 20 years is fairly consistent, but two takeaways stand out: