


With the Dow cracking 21,000 this morning, just over a month after breaking 20,000—and with other indices setting records as well—there are a few questions we need to ask:
• First, how long can the rally last? Is the market bound to come back down as fast as it went up, or can it keep going?
• And second, how high can it go? Even if the rally continues, it will presumably hit a limit at some point. Do we have any idea when that would be?
This could go on for a while . . .
Given the market’s strong performance since the election—and the tendency of markets to keep going in one direction (until they don’t)—I expect that the rally is likely to continue. Here’s why:
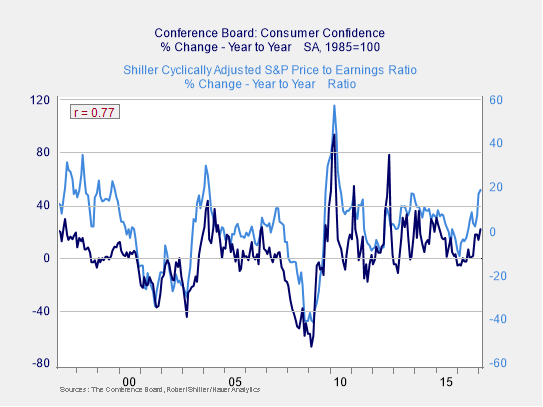
Improving consumer confidence usually drives more expensive stock markets. As you can see in the chart below, changes in consumer confidence track very closely with changes in stock market valuations. With consumer confidence spiking recently, a rise in valuations is both reasonable and likely to continue until confidence rolls over.
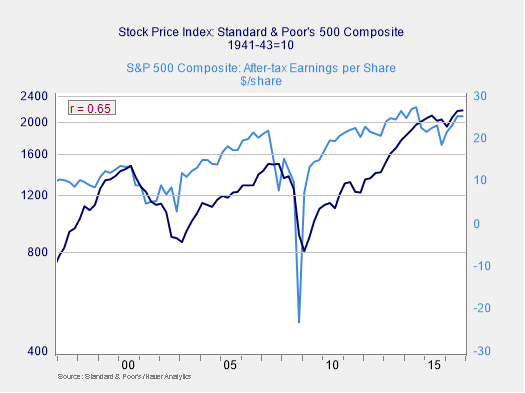
Improving fundamentals drive more expensive stock markets. Here again, we can see a strong correlation between growth in earnings and the stock market. Given recent earnings growth, which is expected to accelerate, more appreciation in the stock market is not only possible but reasonable.
Where is the next ceiling?
Given that we can expect the rally to continue for at least a while, how far can it go?
There are two primary ways to evaluate upside limitations. Looking at previous highs, which often act as a ceiling, simply doesn’t apply, since we are already at all-time highs. In other words, from a technical perspective, there is no ceiling above us. Since we’re in uncharted waters here, the second way to evaluate where we are is to look at history.
Here we run into the challenge of deciding how to measure the market. The typical method is to use price to earnings, or P/E, ratios as a gauge. There are different ways to measure P/Es, though, so that doesn’t really solve the problem. Shorter-term P/Es, based on one year of earnings, typically either overshoot or undershoot depending on whether the year in question is a bad one or a good one. Forward P/Es, which are based on the next year’s earnings, have that problem, as well as the fact that estimated earnings are just that (not real data).