


At a conference last month, I had a discussion with a group of people who were deeply convinced that their taxes were as high as they’d ever been. I mentioned that solving the budget problems of the U.S. would require higher taxes—which wasn’t intended as a recommendation but simply a recognition of the math. The group maintained that it was impossible to raise taxes any further without crippling the economy.
In reality, taxes are low by both historical and world standards. On the other hand, it’s also true that U.S. taxes have increased substantially over the past decade. Failing to recognize either or both of these facts may be distorting how people see the country’s problems, as well as the policy debate.
What do the actual numbers tell us?
There are several ways to look at tax rates:
• The top marginal rate (the highest rate on the highest earners)
• The top effective rate (what the rich actually pay on average)
• The effective and marginal rates on various income groups
Top marginal rate. This chart, from the Mises Institute, shows that marginal rates for the highest earners, on the highest tranches of their incomes, have indeed come down over previous decades but have remained relatively constant since the 1990s.
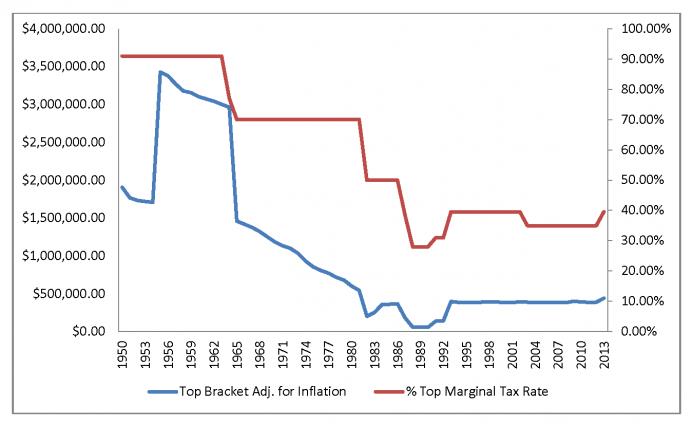
In the 1990s, the marginal tax rate was almost 40 percent, then dropped down to 35 percent, but has since moved back up. In this sense, taxes are down over the past several decades, but roughly constant over the past 20 years.
Effective tax rates. The marginal rate, however, applies only to some taxpayers and to some of their income. A better indicator is the effective tax rates and how they affect different income groups, as shown in the following chart from the Washington Post.
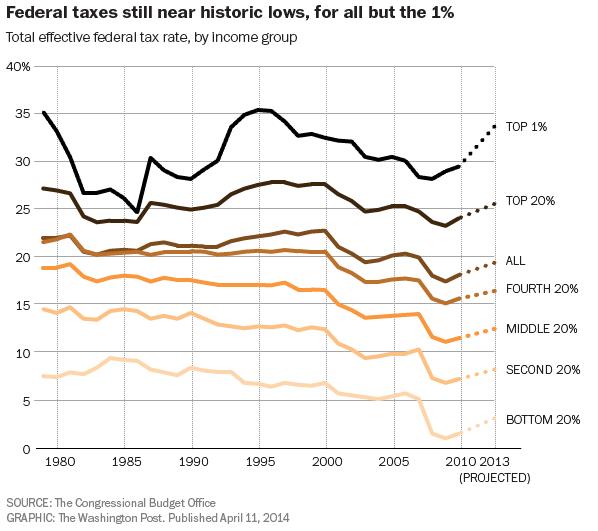
The chart includes all income tranches through the 2013 increase mentioned above. It shows that, on an effective basis, taxes paid remain at levels below any time since the early 1990s. Note also the substantial drop in the late 2000s, which I suspect was caused largely by a drop in incomes, and thus taxes paid, during the Great Recession.
This chart highlights a couple of points. Effective tax rates dropped more, proportionally, for lower income tranches, and the rise in 2013 did not change this. For all groups, effective tax rates remain below those of 1995, despite the 2013 increase. At the same time, the effective tax rate for all groups since 2010 has, in fact, increased substantially. Note also that, since 2005, taxes have increased for the more affluent, while they remain down for all but the top 20 percent.
All a matter of perspective
This brings us back to my initial conversation. People look at their experience over the past few years and note that their taxes are much higher than they were five years ago—prompting them to declare that taxes can’t go any higher. They don’t remember what their taxes were 15 to 20 years ago, when rates were, in fact, higher.
From a policy perspective, this illustrates the problem. Effective tax rates have increased substantially over the past five years (and over the past ten years for the affluent), acting as an economic headwind and creating political resistance. At the same time, on a comparative basis with the mid-1990s, both marginal and effective rates remain relatively low. This situation explains much of the gap in the economic debate between the parties, with the Democrats emphasizing rates low by historical standards while the Republicans point out recent increases. Both are right, and both perspectives need to be considered in any policy formulation.
Taxes raise other questions as well, especially about the effects on economic growth and the deficit. We will take a look at that angle soon. In the meantime, I hope your returns are in the mail (and that the process wasn’t too painful). You should be able to pay your tax bill with a smile—but, unfortunately, they want cash.
Brad McMillan is the chief investment officer at Commonwealth Financial Network, the nation’s largest privately held independent broker/dealer-RIA. He is the primary spokesperson for Commonwealth’s investment divisions. This post originally appeared on The Independent Market Observer, a daily blog authored by McMillan.