This week we look at what the upcoming presidential election may mean for markets in 2016. Following last week’s somewhat surprising news that both Ted Cruz and John Kasich had withdrawn from the race, Donald Trump will be the Republican presidential nominee. Given that Trump has no formal policy record or political experience of any kind, this election cycle is, needless to say, unusual. Markets do not like uncertainty, and Trump undoubtedly brings that to the table.
Although stocks may be more volatile between now and November as market participants size up Trump and assess his chances against presumptive Democratic nominee Hillary Clinton, we believe the typical election year stock market pattern, our assessment of the more likely potential outcomes in November, and the macroeconomic backdrop all still suggest modest gains for stocks in 2016.
Election Year Pattern
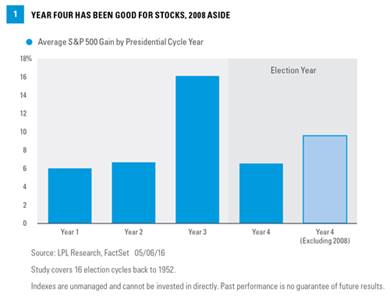
Election years have historically been good for stocks, though not as good as year three [Figure 1]. Year three (the pre-election year) has been the standout performer since 1950, with only one down year out of 17 (flat in 2011 and -0.7% in 2015) and an average S&P 500 gain of 16%. Election years (year four) have also been good, especially excluding the anomaly in 2008, with gains averaging near 10% (better than we expect stocks to deliver in 2016), and positive returns in a solid 87% of years. Since 1960, the only down election years were 2000 and 2008, when the U.S. economy was either sliding into recession or already in one. Bottom line, election years have generally been good for stocks.
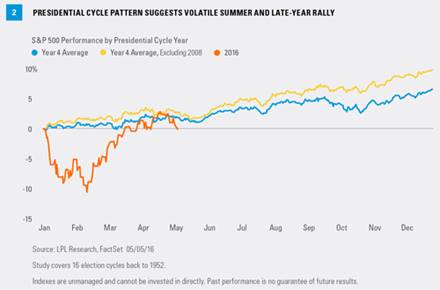
Gains during election years are encouraging, but the path to those gains has historically been volatile. The volatility at the start of 2016 was certainly extreme, but the election year pattern for stocks suggests volatility may persist through the summer months until markets have more clarity on the candidates and their platforms [Figure 2]. Once that clarity arrives, often before the election itself, stocks have typically staged a late-year rally, similar to most years (discussed in our “sell in May” commentary last week).
Though it’s not official—a third-party run is still technically possible—we assume a Clinton-Trump race at this point (even the odds of a Sanders nomination at this point are not zero). Although the nominees are largely locked in, there is still a lot of uncertainty to clear up in terms of the candidates’ platforms, especially Trump’s, which could lead to market volatility and potential buying opportunities.
We would not take the market’s relatively calm response to Trump’s ascension to the top of the Republican Party as a sign of comfort with the idea of him in the White House; rather, we think it’s more a function of the amount of time between now and November. Also keep in mind that some of Trump’s most controversial proposals during primary season, such as mass deportation of illegal immigrants, will not get through Congress and do not warrant a market reaction. Last, early polling (with an emphasis on early) suggests that Clinton would defeat Trump. Like her or not, Clinton has a long public track record and does not bring the same policy uncertainty.
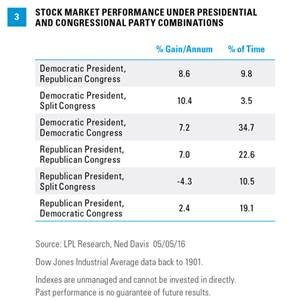
Is Gridlock Good?
The oft-cited market mantra “gridlock is good” suggests that a split Congress, or a President from the opposite party in control of both houses of Congress, would be better for markets. We acknowledge leadership in Washington is only one piece of the story. Historically, the combination of a Democratic President and split Congress has been best for markets, with an average gain of 10.4% for the Dow Jones Industrial Average [Figure 3]. However, that combination has only occurred during the 2010–2014 period (3.5% of all periods), so take those stats with a big grain of salt. Still, this outcome is perhaps the most likely, because—barring a blowout win for Clinton, which could tip the House into Democratic hands—we expect the House to stay Republican and the Senate to follow the White House, where Clinton is currently the favorite. A Republican sweep of the White House and Congress, also a realistic possibility at this point and a fairly common outcome historically (22.6% of periods), has been positive for stocks as well, with an average gain for the Dow of 7%.
It’s also worth noting that stocks have tended to do better when the incumbent party wins the White House. With Clinton ahead in the polls at this point, one could view that as a positive sign. President Obama’s approval ratings have been edging higher recently, which also factors in. But the theory says that the incumbent party wins when the economy is performing well. One could argue, quite rationally, that the economy is disappointing and that Clinton’s lead in the early polls is more a function of Trump’s higher disapproval ratings than an endorsement of the economy. In other words, we are not sure that a Clinton victory should necessarily be viewed as positive for stocks because of party continuity.