PART II of II
Executive Summary
Traditional institutional portfolios with risk characteristics similar to a 60/40 stocks/bonds allocation are not well-positioned for unexpected inflation. Our conclusion is based on the following findings:
Stocks are not effective inflation hedges, particularly in the short- and medium-term
Traditional institutional allocations resemble a "bet" on low inflation
However, while predicting future inflation is challenging, a risk-based approach to strategic asset allocation may generate more balanced performance across both inflationary and deflationary periods. We also find that:
Gold may not be the most effective inflation hedge available to investors
Tactical hedging against inflation or deflation can be accomplished more effectively with strategies that have a high beta to unexpected changes in inflation
Waiting for a period of high inflation (or inflation uncertainty) to occur may be too late to efficiently hedge against its negative effects
Our analysis examines periods of increasing and decreasing inflation but focuses on unexpected changes which lead to revaluations of asset prices. One of the main drawbacks of traditional inflation analyses is the limited number of observations, as well as the absence of data for some assets such as TIPS in stagflation. A benefit of our focus on unexpected inflation is the ability to observe multiple data points of asset performance in both inflationary and deflationary periods (160 inflation surprise periods vs. only 22 inflation regime periods).
Introduction
In Part I of this paper published in March, 2010 we outlined the major considerations surrounding the potential for an increase in future inflation. In Part II we build upon these insights by examining the strategic case for inflation protected assets in portfolio construction. Our aim in this paper is to provide both a theoretical and empirical framework to examine how inflation protected and inflation sensitive assets may perform given varying inflation levels. For simplicity, we examine the "asset side" of a portfolio, without regard to any specific liability stream which will differ dramatically by investor type. For liabilities that are nominal, liabilities will decrease in real terms due to increasing inflation while liabilities that are inflation adjusting will remain constant (and increase in nominal terms). Of course, these details should be incorporated in any customized asset allocation.
In Section I we provide a theoretical framework to consider how inflation may affect U.S. equity, U.S. Government Bonds, U.S. TIPS, Commodities and other alternative asset classes in the short-, medium- and long-term1. In Section II we analyze the historical performance of these asset classes in various economic environments both individually and in a portfolio context. Finally, in Section III we address methods for tactically hedging inflation using specific strategies.
There are a few important results that emerge from our analysis. First, equities have not been effective hedges against inflation in the short- or medium-term. Given most institutional portfolios have risk characteristics similar to a canonical 60/40 stocks/bonds benchmark, they may not be expected to perform well in inflationary periods. Second, we find that allocating capital to commodities and TIPS can improve the performance of portfolios in inflationary regimes. Third, that an equal risk-based approach across U.S. equity, U.S. Government Bonds, U.S. TIPS and Commodities may provide more balanced performance than a canonical 60/40 portfolio across both inflationary and deflationary periods. Fourth, we find that specific strategies which may be considered for their inflation hedging characteristics demonstrate varying efficacy in their ability to compensate investors for unexpected inflation. These results suggest investors do have tools available to protect against unexpected inflation if they incorporate them into their asset allocation before inflationary periods are priced in by the market.
The Impact of Inflation on Asset Prices
Unexpected inflation affects assets by altering the expected value of future cash flows. Although the performance of assets during periods of varying inflation is an important consideration in asset allocation, as discussed in Part I of this series, what we believe matters most to the future performance of asset classes is the unexpected level of realized inflation and changes in the expectations of future inflation. Simply stated, only a realization of inflation which differs from the market consensus or a change in the consensus itself will directly lead to value gained - or lost - by holding inflation sensitive or inflation protected assets. As a result, this paper will focus on identifying how assets respond to inflation surprises (inflation realizations differing from expectations) and to changes in inflation expectations.
Section I. The Theoretical Framework for the Effect of Unexpected Inflation on:
Equities, Government Bonds, TIPS, Commodities, Alternatives
Equities
Many investors traditionally think of equities as an effective hedge against inflation2. In a frictionless world rising inflation should have no effect on companies' earnings as they can fully adjust prices without lowering demand. Of course, in practice, there are market frictions and the ability of companies to pass on rising costs to customers varies. Furthermore, even if corporate earnings could fully adjust for inflation, investors' required rate of return may increase if inflation expectations rise. Inflation is generally a persistent phenomenon and unexpected inflation tends to cause market participants to expect higher inflation in the future. Therefore, unexpected changes in inflation will in practice affect corporate earnings and equity prices (to varying degrees).
Focusing on unexpected increases in inflation, company earnings may actually benefit in the short term as depreciation expense is understated (since replacement costs will be higher) and wages adjust more slowly than the prices of output goods and services (described by the infamous Phillips Curve). However, this short term effect is not necessarily a benefit to equity prices if investors are forward looking and focus on the longer term detrimental effects of higher inflation. In fact, we have seen that stock valuations tend to be compressed in the short- and medium-term in inflationary periods3,4.
Over the long term, if monetary policy is not sufficiently aggressive to moderate inflation expectations, market participants will eventually adjust and reach a new equilibrium where persistently high inflation is both expected and realized. In that state of the world, equity holders may not be fully compensated for persistently high inflation due to real economic costs of high inflation which act as a drag both on earnings and equity prices. In fact, we expect stocks to have a long term nominal return that is higher in inflationary periods, though we also expect that real returns would otherwise be higher without inflationary pressure. Long term inflationary periods create a negative pressure on corporate earnings as consumers are pushed into higher tax brackets and consume less5. Higher effective tax rates might also increase investors' required rate of return beyond the direct effect of inflation if they are to maintain a consistent after-tax real return on capital, which will affect equilibrium prices.
Therefore, persistently high inflation tends to have a negative effect on stocks as both corporate earnings and the multiples investors are willing to pay for earnings are compressed. This is not to suggest that nominal stock prices will decline in inflationary periods but rather that they will not necessarily adjust enough to keep real prices constant. The long term negative effect of high inflation on real stock prices will be moderated to the extent that monetary authorities are effective in tightening monetary policy and reducing inflation expectations.
Government Bonds
Unexpected inflation typically leads to an increase in nominal yields as investors revise upward their expectations for future inflation. If investors had been anticipating low and steady inflation, an inflation shock may lead investors to expect more uncertainty about the future rate of inflation. This will raise the risk premium investors require to hold nominal bonds, putting upward pressure on yields (and increasing the cost of inflation protection). Moreover, unexpected inflation will put upward pressure on bond yields if monetary authorities act to raise effective real interest rates.
As described in Part I of this paper, the following factors are the primary components which may determine the yield of government bonds above the risk-free rate (excess yield)6:
1. "Real" Term Premium - compensation for the risk associated with holding a longer-term bond and taking the risk of real rates moving
2. Inflation Expectation - compensation for expected future changes in inflation (inflation term structure)
3. Inflation Risk Premium - compensation for assuming the risk of changing inflation (inflation uncertainty)
Therefore, since [Nominal Yield = Risk Free Rate + Real Term Premium + Expected Inflation + Inflation Risk Premium], an increase in expected inflation or inflation uncertainty will put upward pressure on nominal yields (decreasing prices).
Treasury Inflation Protected Securities (TIPS)
Treasury Inflation Protected Securities (TIPS) are U.S. government bonds whose principal and coupons are adjusted for inflation. In the U.S., the value of TIPS will increase based on changes in the Consumer Price Index (CPI). Assuming no risk of the U.S. government defaulting, TIPS provide full compensation for changes in CPI. Therefore, TIPS are the "real" risk free asset to investors who hold them to maturity and seek protection from unexpected increases in the CPI. However, TIPS' daily market values are sensitive to changes in real interest rates and the risk premium associated with future real rates. Therefore, if not held to maturity (and for a portfolio which is marked-to-market) TIPS' performance may not fully hedge the effects of inflation. Because the primary tool for the Fed to combat inflation is increasing real rates, TIPS' mark-to-market value may be negatively affected during inflationary periods, offsetting some, or all, of their inflation hedging characteristics7.
Commodities
Commodities are considered effective inflation hedges for at least two reasons. First, commodity prices are relatively flexible (as demand is relatively inelastic) and tend to quickly adjust to changes in the general price level. Second, commodities can actually be a direct cause of inflation and be accelerating faster than the general rate of inflation. This was the case in the 1970's as commodity price moves contributed to a global stagflation (increasing inflation during a recessionary period). Under these conditions, central banks are less likely to tighten monetary policy because they will further exacerbate recessionary pressures. In this scenario, commodity price increases are more likely to remain unchecked and can accelerate at rates far above the general rate of market price changes. Therefore, if inflationary pressures are actually led by commodities, they are likely to serve as an especially effective inflation hedge.
It is important to note that commodities are not expected to serve as an efficient hedge in all inflationary environments. For example, in a stagflation driven by decreasing demand and loose monetary policy, like the fiscally driven inflation many investors currently fear, commodity prices may trail inflation as weak demand causes their prices to fall in real terms.
Alternative Allocations
There is a multitude of alternative asset classes that have varying degrees of potential inflation hedging characteristics from timber and infrastructure projects to other private investments and hedge funds. It is intuitive that the better the ability to adjust the price of the underlying asset (with low impact on volume demanded) or its cash flows, the better the inflation hedging characteristics will be. For example, the inflation hedging efficacy of utilities largely depends on the projects' pricing power - the more constrained profits are by a regulatory framework, the lower their ability to track unexpected increases in inflation. Real estate's inflation hedging characteristics may be dependent on the flexibility to adjust rents since operating costs are partially fixed (shorter-dated leases may adjust more quickly to inflation than longer-dated contracts).
Private investments and hedge funds may also exhibit potential inflation hedging characteristics as they are able to dynamically control their investment processes in response to changes in market conditions and unexpected inflation, though the degree of their efficacy is highly specific to each investment strategy. While it may be possible to analyze the inflation hedging characteristics of specific hedge fund sub-styles (for example, Managed Futures, Fixed Income Arbitrage, etc), that is beyond the scope of this paper8.
Because the alternative investment category (private equity, infrastructure, real estate, hedge funds, etc.) is heterogeneous and not a definable asset class it is not possible to create a theoretical construct for how alternatives in aggregate should singularly respond to inflation; rather each individual strategy requires investors to perform an in-depth analysis to develop the framework on a case-by-case basis. We touch on a few specific alternative strategies in Section III.
Section II. Effect of Inflation on Strategic Asset Allocation
Empirical Evidence on: U.S. Equity, U.S. Government Bonds, TIPS, Commodities
We have discussed the theoretical framework for how Equity, Government Bonds, TIPS and Commodities9 may perform during periods of unexpected changes in inflation. We now turn to examine the historical performance of each of the aforementioned asset classes during various inflationary periods in the U.S. and in response to unexpected changes in inflation. As we have pointed out, only unexpected inflation or changes in inflation expectations can be the source of value gained - or lost - due to inflation. To add further precision to the analysis we examine combinations of inflation and growth, since inflation during periods of growth or recession are very different economic environments with varying effects on assets. For example, inflation can occur in periods of an over-heating economy or in a stagnating economy. We exclude the general Alternatives category since this is not a homogenous asset class with a single identifiable return stream.
We use three metrics for the impact of inflation on asset prices: 1) performance as a result of unexpected inflation (inflation surprise); 2) performance in increasing and decreasing inflation regimes; and 3) correlation of asset returns with future inflation (proxy for changes in inflation expectations). We measure performance as the risk-adjusted returns excess of cash (Sharpe Ratio) since this offers a direct comparison across assets and time horizons, regardless of each individual asset's volatility, variation in volatility over time and fluctuating cash rates. Focusing on returns, regardless of risk (as proxied by volatility) and changing cash rates obscures the relative effect of inflation on individual assets as well as the absolute effect on risky assets in aggregate.
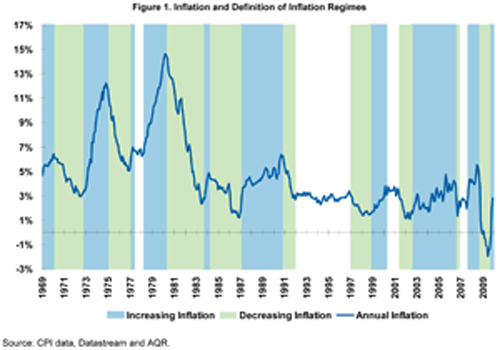
By analyzing the performance of asset classes in response to annual inflation and growth surprises we develop a more robust series of data with multiple observations in all four of our defined economic environments (positive/negative inflation and growth surprise). We observe 160 inflation surprise periods vs. only 22 distinct inflation regime periods since we have quarterly surprise data while inflation regimes often last more than one year (see Figure 1 below). This partially overcomes one of the main weaknesses in standard inflation analyses of various assets; while it is crucial to include TIPS in an inflation hedging study, we have simply not witnessed all four positive/negative inflation and growth environments over the short history we have data available since TIPS were introduced in 1997. However, by analyzing annual inflation and growth surprises - the key driver of asset price adjustments - we have multiple observations in each of our four defined economic environments. Of course, this methodology is limited by a lack of large magnitude moves in inflation since 1997. However, we believe the direction of asset price changes is observable even at small magnitudes, allowing a more meaningful analysis of assets' inflation sensitivity than traditional analyses focusing solely on inflation regimes. Moreover, this methodology somewhat mitigates the impact of extraneous factors that affect asset returns over long periods, such as the declining real interest rate environment observed over the last 20 years, which is difficult to separate from inflation effects in traditional analyses.
In addition to analyzing each asset class individually, we also examine how several portfolios constructed from these asset classes respond to inflation and growth surprises.
The Effect of Inflation on the Performance of Major Asset Classes
To measure the historical effect of inflation and growth surprises (realizations that varied from expectations) we use inflation and industrial production market forecasts as reported by the Survey of Professional Forecasters. The actual measure compares annual inflation realizations to annual inflation forecasts lagged by a year. The measure is collected on a quarterly basis. We classified this data into four environments with the combination of positive (higher than expected) and negative (lower than expected) surprises to inflation and industrial production. We utilize industrial production surprises because the data is tracked monthly, fundamentally affects the real cost of capital, and is a proxy for the state of the business cycle.
To examine the historical performance of each asset in different economic environments as defined by varying levels of inflation and growth (as opposed to inflation surprises), we classify inflation "regimes" according to the cross-section of increasing or decreasing levels of inflation and industrial production growth. We classify timeframes into increasing and decreasing inflation periods to examine how asset prices have responded historically in these distinct environments. Figure 1 depicts inflation and the various inflation regimes.
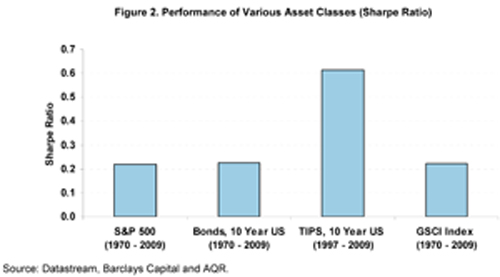
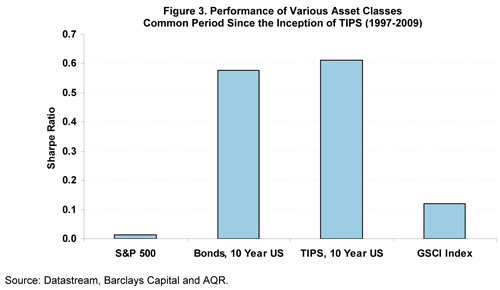
Looking at the full set of data for U.S. equity, U.S. Government Bonds, Commodities (GSCI Index) and TIPS, Figure 2 displays the risk-adjusted performance in excess of cash (Sharpe Ratio).10 We include data from 1970-2009 for stocks, bonds and commodities, but only from 1997 for TIPS since that is when they were first introduced. For purposes of comparison, we further display in Figure 3 the common period for all four assets (1997-2009). The results show that bonds and TIPS have performed exceptionally well, as real interest rates have consistently declined over the last twenty years.
Turning our attention to performance based on inflation surprises, we focus on absolute performance in positive and negative surprise periods and the relative performance between the two environments. The results are presented in Figures 4 and 5. Commodities and TIPS performed well in periods of positive inflation surprise, while stocks and bonds lag. As can be seen in Figure 4, contrary to expectations, the absolute Sharpe Ratio of bonds has been positive in both positive and negative inflation surprise periods. We believe the historical positive performance of bonds in inflation surprises can be explained by the protracted decline in real rates over the last 20 years and the relatively moderate level of inflation surprises over this period. This illustrates the importance of relative performance (in Figure 5) when attempting to identify assets' sensitivity to inflation.
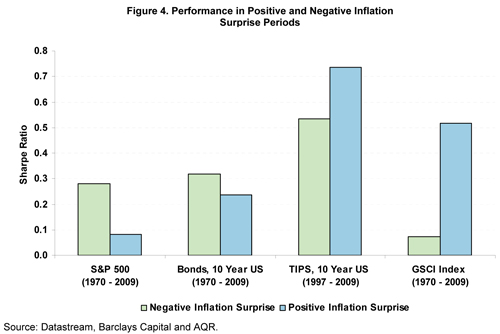
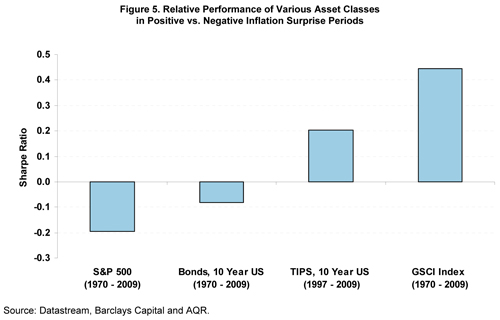
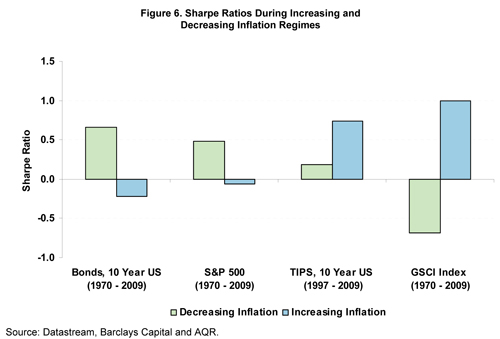
Figure 6 depicts the Sharpe Ratios of each asset in periods of increasing and decreasing inflation (as opposed to inflation surprises) since 1970 or since 1997 for TIPS. As expected from our theoretical analysis in Section I, stocks and bonds are meager performers in periods of increasing inflation. TIPS and commodities, on the other hand, perform better in these periods. Focusing on relative performance, which is observable as the difference in Sharpe Ratios for each asset between the
environments (Figure 7), we see similar results to our inflation surprise analysis, with commodities having the highest positive sensitivity (or beta) to changing inflation, while nominal bonds have the largest negative sensitivity.
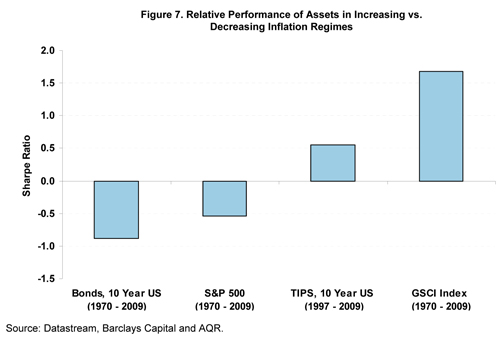
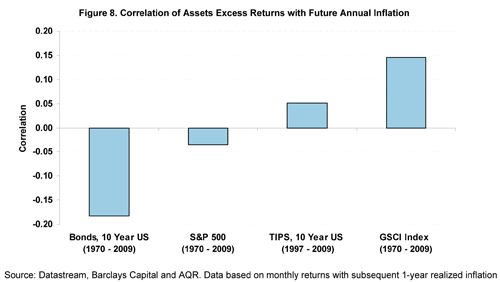
Figure 8 presents the correlation of assets' returns with subsequent realized inflation, based on monthly returns with subsequent 1-year realized inflation. The results are consistent with the relative performance in inflation regimes where commodity returns are positively correlated with future inflation and bonds are negatively correlated with future inflation. This suggests that commodities and bonds are both sensitive (in opposite directions) to changes in inflation expectations.
Inflation and Growth
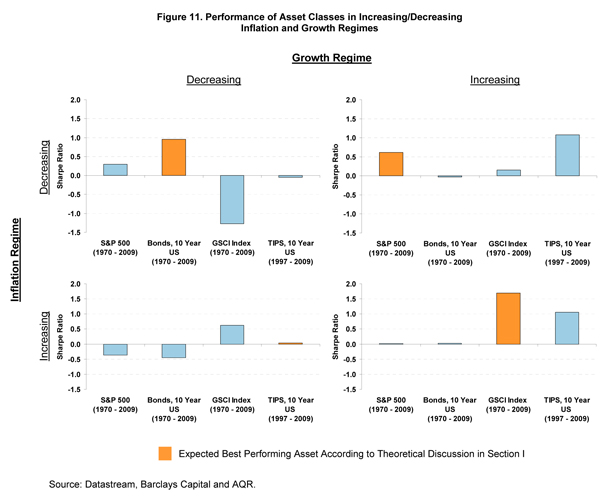
We believe it is important to further segment inflationary and disinflationary periods into environments of positive or negative growth because, as our theoretical discussion suggested, assets will respond to inflation changes differently based on the business cycle. Figure 10 shows the performance of each asset class across the four distinct inflation and growth surprises. Figure 11 shows the same data according to inflation and growth regimes. In Figures 10 and 11, we highlight the asset that we expect to perform especially well in each environment, as summarized in Figure 9.


Theoretical Performance of Assets in Inflation and Growth Environments
Stocks, Government Bonds, Commodities and TIPS sorted by each environment's expected highest Sharpe Ratio asset
A few interesting results are evident. As can be seen in figure 10, assets' response to inflation and growth surprises generally performed in line with our theoretical framework. Stocks have not performed well in response to inflation surprises, especially when accompanied by a positive growth surprise. This may be due to market expectations that the Fed would raise real interest rates to fight an overheating economy. Bonds performed well in response to disinflationary surprises when accompanied by a negative growth surprise since interest rates generally decrease during recessionary periods. They also performed well in positive inflation surprise periods accompanied by a negative growth surprise, since interest rates generally fall in that environment. Commodities show strong performance during inflation surprises, even in periods of negative growth surprises which may be attributable to the 1970s commodity-led stagflation.
Turning to Figure 11 and specific inflation regimes, we see that our theoretical framework is supported by the data with the exception of TIPS, which had flat performance during increasing inflation and decreasing growth periods. The TIPS results may be driven by their liquidity premium explored in Part I of this series; TIPS are historically less liquid than nominal bonds on the secondary market and therefore may suffer in a general de-risking environment associated with periods of recession, and simultaneously benefit from return to risk-seeking in expansionary growth periods. The importance of the liquidity premium has been declining since 2003 and may decline in the future as a result of an increase in both U.S. TIPS issuance and investors' interest in holding them. It is important to reiterate that the data in Figure 11 is limited by fewer data points than our inflation surprise analysis. Specifically, we observe few periods with increasing inflation and decreasing growth which limits the reliability of this traditional inflation analysis (which is one reason we previously focus on unexpected inflation changes).
Summary of Results: U.S. Equity, U.S. Government Bonds, TIPS, Commodities
One of the main drawbacks of traditional inflation analysis across stocks, bonds, commodities and TIPS is the limited number of observations in all inflation and growth environments, as well as the absence of data for some assets such as TIPS during stagflation. A benefit of our approach in examining both inflation regimes and inflation surprise data is the ability to observe multiple data points of asset performance in each inflation and growth environment. Furthermore, as we have pointed out in Section I, we argue it is unexpected changes in inflation and inflation expectations that directly leads to value gained - or lost - which we are directly measuring.
As suggested by our theoretical framework, equities have not been an efficient short- and medium-term inflation hedge as they have performed poorly following inflation surprises, even if accompanied by a surprise in positive economic growth. However, equities have performed exceedingly well in periods of a positive growth surprise and a negative inflation surprise, when other asset classes have under-performed. In line with expectations, government bonds did perform well in decreasing growth periods with decreasing inflation, as well as in periods of a negative growth surprise. TIPS have performed well in periods of a positive inflation surprise but also in periods of a negative growth surprise, as real yields decline. TIPS provide inflation protection and should perform well in periods of increasing inflation as well as periods of decreasing real rates, which tend to occur during recession. Commodities have been effective hedges against inflation, especially during periods of increasing growth.
Inflation and Strategic Asset Allocation
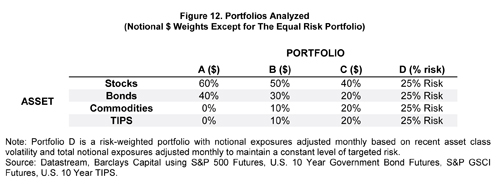
After examining how asset classes have performed in each inflation and growth regime individually, we turn our attention to asset allocation at the portfolio level. We will examine the traditional 60/40 stocks/bonds allocation as well as three more diversified portfolios using stocks, bonds, commodities and TIPS11. In two of the alternative portfolios we take an increasing percentage of capital from the 60/40 portfolio and allocate to commodities and TIPS12. The final alternative portfolio uses an equal-risk allocation across all four asset classes13.
Because unexpected inflation drives asset price changes we focus on inflation and growth surprises rather than performance of assets during increasing and decreasing inflation and growth regimes. The performance data during some of these regime scenarios is sparse, and TIPS did not exist during a stagflation since their 1997 introduction. This is reflected by the inconclusive results on TIPS using regime data in the previous section on asset class performance.
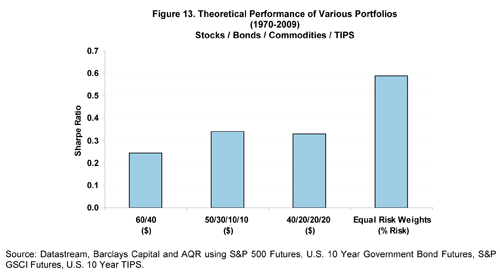
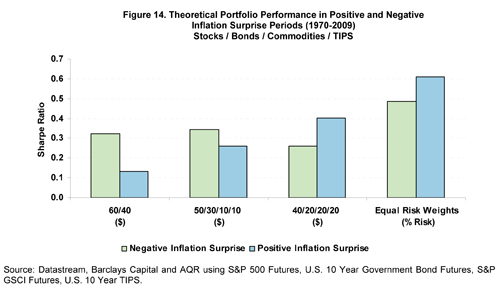
We start by considering the absolute performance of the four theoretical portfolios, presented in Figure 13. As the Figure shows there is very little difference in Sharpe Ratios across the first three equity-focused portfolios. The equal risk-weighted portfolio has performed significantly better with a Sharpe Ratio of approximately 0.6. This result is consistent with other studies of historical performance of risk-weighted or "risk parity" portfolios. This improvement in overall performance versus the capital weighted portfolios is due to better diversification by allocating more to lower-risk assets, maintaining diversification through time by rebalancing risk as assets or the market overall experiences changing volatility, and in part due to a higher allocation to TIPS which have had a strong relative performance (Sharpe Ratio) since inception. Figure 14 shows the relative performance of the various portfolios in negative and positive inflation surprise environments. As expected, the traditional 60/40 portfolio has performed well in negative inflation surprise environments when stocks and bonds outperform. However, a 60/40 has meager performance in positive inflation surprise environments as both assets are poorly hedged against inflation. Moving more weight to other asset classes improves the relative performance in positive surprise environments, albeit at the expense of giving up some performance in negative surprise environments. The equal risk-weighted portfolio, however, achieves better performance in positive inflation surprise environments without the associated drag on performance in negative inflation surprises. The relative performance of the equal risk-weighted portfolio in positive inflation surprise periods is higher than in negative surprise periods, suggesting that it provides better inflation hedging properties than the 60/40 portfolio. Furthermore, this portfolio has a more balanced performance across environments. The last point is important as investors are, therefore, taking less of a "bet" on the direction of inflation. As mentioned previously, relative performance in response to changes in unexpected inflation is a more meaningful measure of asset price sensitivity to inflation than examining performance during inflation regimes, since asset prices may have priced in changing inflation expectations before they first begin to materialize.
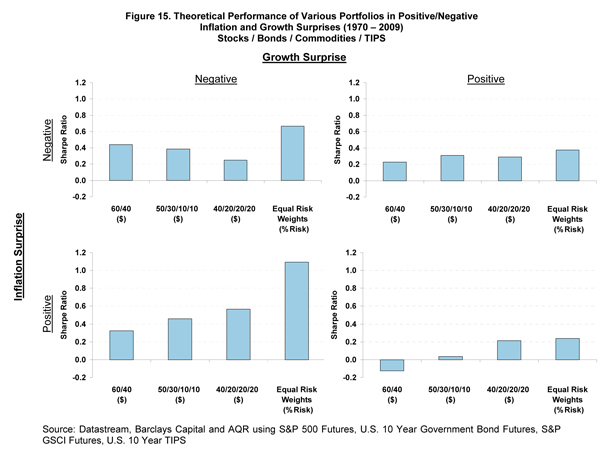
Consistent with our previous analysis of each asset class individually, Figure 15 considers how the four portfolios perform in each of the inflation and growth surprise scenarios. The 60/40 portfolio performs poorly during positive inflation surprises. Portfolio B and C, with allocations to commodities and TIPS, improved performance during inflationary periods. An equal risk-weighted portfolio improved performance in both inflationary and disinflationary periods as the diversification across both inflation hedging and growth allowed it to perform relatively well in each scenario. Referring back to Figure 9, this result is not theoretically surprising. Given a base-case assumption that each environment may be equally likely to occur on average, allocating 25% of a portfolio's risk to each asset class examined could be a reasonable approach to benefit from economic growth and serve as a potential hedge against the negative effects of inflation and/or recession.
Of course, the four asset classes studied are not the comprehensive set of assets that may be included in a portfolio. It is possible to build a more diversified equal risk-weighted portfolio with the inclusion of additional assets.
Section III. Evaluation of Other Liquie Potential Inflation Hedges
Up to this point we considered the four main asset classes - Equity, Government Bonds, TIPS and Commodities which are core assets in most institutional investor portfolios. We have also analyzed these assets in a portfolio context to examine the inflation sensitivity of various strategic allocations. However, many institutional investors may wish to target inflation hedging without altering their current strategic asset allocation. Therefore, in this section we expand the set of liquid strategies which may be considered in a portfolio specifically designed to serve as an efficient inflation hedge (we focus on the liquid universe of assets for data availability and comparison purposes). This analysis is most relevant for investors seeking to add inflation protection to their portfolio without altering their core strategic allocation. For example, an investor with a traditional stocks and bonds portfolio may be prevented from dramatically altering that allocation for governance reasons and might seek a pure inflation protection strategy to add at a more modest weight.
Adding to the previous analysis of the four primary asset classes, we analyze other strategies that may be considered by institutional investors when analyzing the inflation hedging potential of individual assets. Specifically, we present inflation breakevens (TIPS - Nominal Government Bonds), infrastructure-related equities, commodity-related equities, REITS, gold futures, Timber (lumber futures) and a strategy that invests in a basket of emerging currencies. The previous section showed that equities are not effective hedges against inflation over the short- and medium-term. As a result, we focus on beta-neutral portfolios of equity related assets (infrastructure, commodity related equities and REITS)14 by hedging their passive equity beta in order to isolate the inflation effect on each individual asset.
We include Inflation Breakevens since they may be the most direct hedge against inflation (as measured by CPI). Moreover, an Inflation Breakeven position is not directly affected by real interest rate moves. This is in sharp contrast to both nominal bonds and TIPS. An Inflation Breakeven position is comprised of a long position in an inflation-linked bond and a corresponding short position in a duration-matched nominal government bond. The return on an Inflation Breakeven position if held to maturity should include the difference between realized and expected inflation, a negative premium due to the insurance-like protection from inflation risk that nominal bond holders are compensated for, and a positive premium due to liquidity risk as TIPS are generally less liquid than nominal government bonds. Changes in inflation expectations and TIPS' associated risk premia will affect the price of the breakeven position prior to maturity. An increase in inflation expectations, for example, will cause the price of nominal bonds to fall, resulting in a capital gain for the Inflation Breakeven position. It is important to note that an Inflation Breakeven strategy has a negative expected return since it is primarily an insurance-related payoff which requires compensation to the providers of this insurance, which in this case are nominal bond holders.
Gold, lumber, REITS, commodities and infrastructure-related equities are often mentioned as potential inflation hedges as their cash flows are derived from real assets. The basket of emerging currencies can be thought of as a negative dollar bet that pays a risk premium over the long term. In cases of isolated or high relative U.S. inflation, the dollar is expected to depreciate relative to other currencies. Emerging currencies are especially interesting hedges if inflation is accompanied by a rise in commodity prices as emerging markets are large commodity exporters. Emerging market currencies tend to pay a "default risk" premium which is not related per se to U.S. inflation and therefore has a positive expected return, in contrast to a pure Inflation Breakeven strategy which has an expected cost.
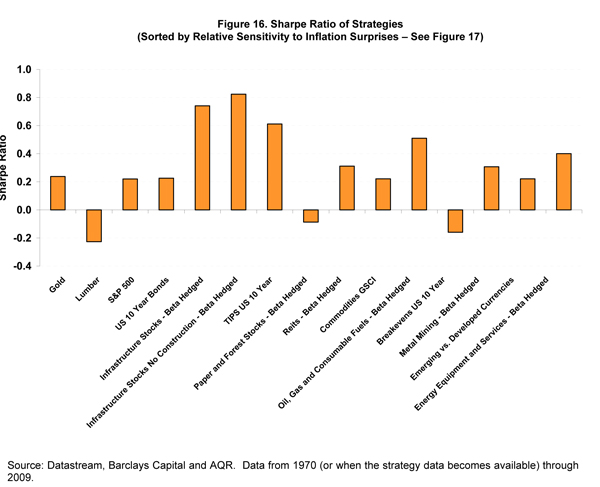
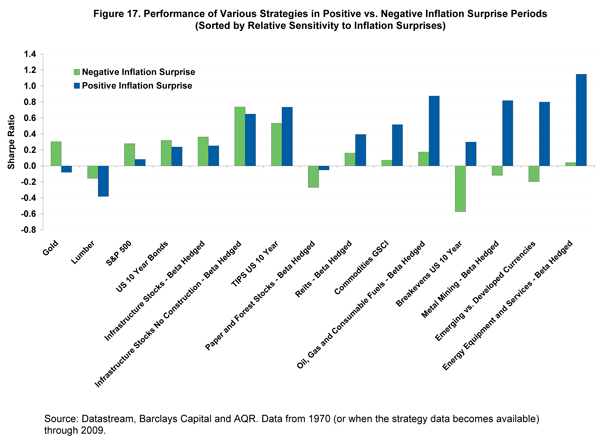
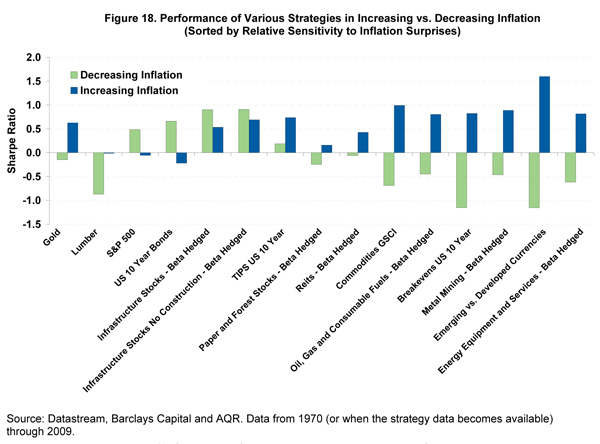
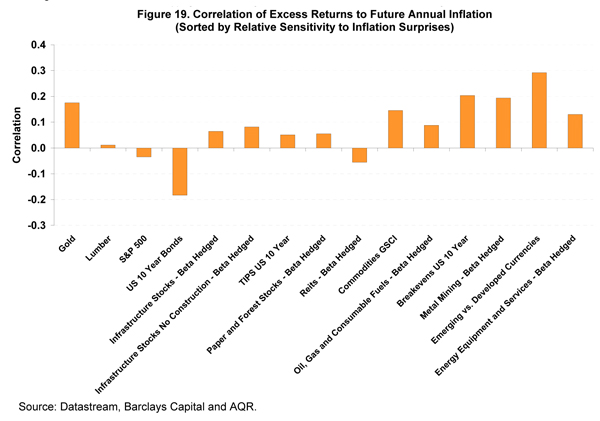
Figure 16 shows the absolute realized Sharpe Ratio of each individual asset class studied. Figures 17, 18, and 19 present their performance based on the three inflation hedging metrics. To facilitate easy comparison of strategies across different performance metrics we sort assets in all figures by the relative performance in inflation surprise environments.
The most notable inflation hedging strategies across all categories are Inflation Breakevens, emerging currencies, commodities and commodity-related equities. Inflation Breakevens, as previously pointed out, have negative long-term expected returns, as the investor "pays" an inflation protection premium to nominal bond holders (since the Breakeven position requires a short position in nominal bonds). The other strategies studied had historically positive excess returns which is partially explained by other risk premia associated with those strategies.
Contrary to common wisdom, assets like REITS, lumber and infrastructure equities did not show strong inflation hedging properties. This may be due to the extraneous risks these assets are also affected by such as real supply and demand factors. Gold is often a default asset that investors turn to when inflation uncertainty increases. However, as can be seen from the results, gold primarily reacts to changes in inflation expectations ahead of actual realized inflation. Therefore, the inflation hedging power of gold may be realized in a period preceding an actual increase in realized inflation. If investors add gold to a portfolio once early signs of increasing inflation are anticipated, they risk not realizing gold's inflation hedging characteristics.
A direct inflation hedging portfolio should generally be designed with similar portfolio construction techniques as a broader asset allocation, adhering to the principles of diversification, risk budgeting and cross-asset correlations. An effective inflation hedging portfolio may utilize multiple asset classes in proportion to their overall expected inflation hedging characteristics, portfolio risk contributions and target returns. In general, the greater the desired certainty of inflation protection, the lower the expected return will be (and in fact will be negative for a pure inflation breakeven strategy). However, the inclusion of additional strategies that have generally good inflation hedging properties with varying risk factors, such as those studied in this analysis, can potentially mitigate the expected costs of an inflation protection strategy since these risk factors may have positive expected returns.
Conclusion
We have studied both four primary asset classes - stocks, bonds, commodities and TIPS as well as four overall asset allocations to assess their performance in inflation regimes and in response to unexpected inflation. As discussed, we believe the inclusion of asset class performance in response to unexpected inflation is more robust than simply analyzing inflation regimes, which is the traditional analysis used by practitioners to evaluate inflation sensitivity of assets and strategies. The advantage of using surprise data is that it is has multiple observations available for each inflation and growth scenario and that it directly measures the main aspect of inflation that requires hedging (unexpected inflation). We have also studied other liquid strategies for investors seeking pure exposure to inflation protection without altering their core strategic asset allocations.
Our results have shown that stocks are far from an effective short- or medium- term inflation hedge. Government bonds also tend to suffer in periods of increasing inflation. However, commodities and TIPS benefited during periods of increasing inflation. Perhaps the most interesting result of our analysis is the performance of the equal risk-weighted portfolio which performed better on average and is less dramatically affected by each individual inflation and growth scenario. Since the equal-risk weighted allocation has exposure to each asset in proportion to its contribution to overall risk, the portfolio represents less of a "bet" on the future direction of inflation and growth and should theoretically serve investors well both on average and in each potential economic environment. This is not to suggest that the equal-risk weighted portfolio across equity, government bonds, inflation-linked bonds and commodities is the optimal portfolio as indeed we believe it is possible to build more efficient portfolios with the inclusion of additional assets and strategies; the equal-risk weighted methodology across the four core assets serves to simply illustrate the comparative benefits of diversifying across asset classes to prepare for differing potential economic environments. Moreover, the higher relative performance historically of the equal-risk weighted portfolio in positive inflation surprise periods (Figure 14) suggest that it may over-emphasize inflation protection unless investors attribute a higher probability of positive versus negative inflation surprises.
We show multiple liquid strategies with strong inflation hedging properties. However, as we have pointed out, asset prices adjust to unexpected inflation and changes in inflation expectations. Because investors are forward looking, inflation expectations may change early in an inflationary cycle. Therefore, an investor who tries to time the purchase of inflation protection may fail to realize the value of the asset's hedging properties if its price has already begun to adjust. This argument favors a long-term strategic allocation which prepares for various economic environments including the possibility of higher inflation or, at the very least, a tactical strategy which acts before the market begins to price in changing expectations or increasing inflation uncertainty.
Disclaimers:
The views and opinions expressed herein are those of the author and do not necessarily reflect the views of AQR Capital Management, LLC its affiliates, or its employees.
The information set forth herein has been obtained or derived from sources believed by author to be reliable. However, the author does not make any representation or warranty, express or implied, as to the information's accuracy or completeness, nor does the author recommend that the attached information serve as the basis of any investment decision. This document has been provided to you solely for information purposes and does not constitute an offer or solicitation of an offer, or any advice or recommendation, to purchase any securities or other financial instruments, and may not be construed as such. This document is intended exclusively for the use of the person to whom it has been delivered by the author, and it is not to be reproduced or redistributed to any other person.
Diversification and inflation hedging does not eliminate the risk of experiencing investment losses. Past performance is not an indication of future performance.
There is a risk of substantial loss associated with trading commodities, futures, options, derivatives and other financial instruments. Before trading, investors should carefully consider their financial position and risk tolerance to determine if the proposed trading style is appropriate. Investors should realize that when trading futures, commodities, options, derivatives and other financial instruments one could lose the full balance of their account. It is also possible to lose more than the initial deposit when trading derivatives or using leverage. All funds committed to such a trading strategy should be purely risk capital.
Michael Katz, Ph.D. and Christopher Palazzolo, CFA are both vice president's at AQR Capital Management.
1 While it is difficult to precisely define short-, medium- and
long-term time periods, we generally define short-term as less than 1
year, medium-term as 1-5 years, and long-term as more than 5 years.
These time periods have tended to coincide with business cycles which
on average are 3-5 years, while major pricing adjustments occur in the
short-term 1 year horizon and asset pricing reversals occur beyond the
5 year horizon due to mean reversion.
2 Inflation is defined as an increase in the cost of living. This is an abstract concept and varies by individual and entity. In this paper, we focus our analysis on the U.S. Consumer Price Index (CPI) which is a proxy for general price levels in the U.S. The relevance of the CPI to specific individuals or entities will vary in proportion to how closely liabilities match the basket of goods and services in the CPI. There are a wide variety of both supportive as well as critical studies on the methodologies used to calculate the CPI. Our view is that while there may be more accurate potential inflation measures, CPI does serve as a reasonable proxy for general inflation and will be highly correlated with the inflation sensitivity of most individual or entity liabilities.
3 There is much academic debate as to what may cause the short- to
medium-term negative effect of unexpected inflation on equity prices.
There are primarily two schools of thought that can broadly be
categorized as Behavioral and Rational. Specifically, the Behavioral
camp suggests that: 1) Investors may not properly account for the
capital gain realized by indebted companies during unexpected increases
in inflation, as the real cost of that debt declines and 2) Investors
may improperly discount future real cash flows by using nominal rates,
creating a negative inflation illusion that puts downward pressure on
equity real values. The Rational camp suggests that 1) companies face
real distortions as a result of unexpected increases in inflation which
negatively impact earnings and 2) Investors may increase their real
required rate of return as compensation for higher uncertainty during
periods of increasing inflation. Of course, it is possible that a
combination of both Behavioral and Rational theories explain the
tendency for stock valuations to compress during periods of unexpected
inflation. Exacerbating these effects are non-market factors such as
the likelihood that real interest rates may be increased during
inflationary periods if monetary authorities seek to combat inflation
with higher borrowing costs which hurts corporate earnings and
increases investors' required rate of return after an inflation shock.
4 An example of the inflation illusion in stock prices is captured in what is known as the "Fed Model" which relates Price-to-Earnings ratios to nominal government bond yields. There is wide empirical evidence which suggests that stock prices do respond to nominal yields, which contradicts the belief that stocks are good inflation hedges driven by real yields. For a comprehensive exposition on this inconsistency see "Fight the Fed Model" by Cliff Asness, Journal of Portfolio Management, Fall 2003.
5 It is generally assumed that governments do not adjust nominal tax brackets to compensate for inflation changes, since it may lower tax revenues.
6 The risk-free rate here is assumed to be U.S. T-bills which do reflect short-term inflation expectations.
7 It is important to note that many inflation-linked bonds including U.S. TIPS have an embedded principal "floor" which means that their inflation adjusted principal value on which the yield is determined will not decrease below the bond issuance par value (usually 100). This floor serves as a deflationary protection which mimics a call option on inflation with a strike price of CPI measured at time of issuance. This effect can be significant for TIPS that are issued in periods of deflationary pressure since the option value is more likely to be relevant. This also generates a premium for recently issued TIPS after a period of inflation since new issues have an inflation adjusted par value closer to a floor of 100, whereas an older issue may have a principal face value far in excess of its floor of 100 and be more sensitive to deflation.
8 AQR proprietary data includes performance of hedge fund sub-styles which may be used in inflation analyses. There are also other public sources of hedge fund sub-style returns.
9 For commodity returns we use the S&P GSCI Index. Although the Index is dominated by energies since it is production-weighted, cost of living (and CPI) is heavily driven by energies relative to other commodities.
10 Throughout the analysis we use excess returns over cash for consistency and comparison purposes. Returns on stocks, bonds and commodities are based on the returns of S&P 500 futures, 10 year bond futures and the GSCI index futures instead of the cash instruments themselves due to their superior liquidity and comparability.
11 60/40 portfolio defined as 60% S&P 500 Total Return / 40% U.S. 10-Year Government Bonds
12 TIPS are allocated weight in the portfolio after they were introduced in 1997. Before that TIPS weight is allocated to other assets proportionately. That is, in a 40/20/20/20 portfolio stock, bonds and commodities will receive the weights 50/25/25.
13 Equal risk portfolio calculated monthly using AQR proprietary risk model based on historical returns
14 We use index future contracts to hedge the beta exposure of the various equity related assets.