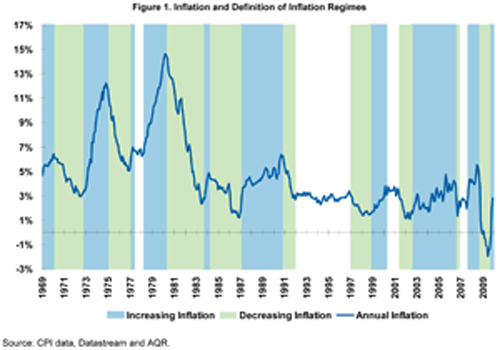
By analyzing the performance of asset classes in response to annual inflation and growth surprises we develop a more robust series of data with multiple observations in all four of our defined economic environments (positive/negative inflation and growth surprise). We observe 160 inflation surprise periods vs. only 22 distinct inflation regime periods since we have quarterly surprise data while inflation regimes often last more than one year (see Figure 1 below). This partially overcomes one of the main weaknesses in standard inflation analyses of various assets; while it is crucial to include TIPS in an inflation hedging study, we have simply not witnessed all four positive/negative inflation and growth environments over the short history we have data available since TIPS were introduced in 1997. However, by analyzing annual inflation and growth surprises - the key driver of asset price adjustments - we have multiple observations in each of our four defined economic environments. Of course, this methodology is limited by a lack of large magnitude moves in inflation since 1997. However, we believe the direction of asset price changes is observable even at small magnitudes, allowing a more meaningful analysis of assets' inflation sensitivity than traditional analyses focusing solely on inflation regimes. Moreover, this methodology somewhat mitigates the impact of extraneous factors that affect asset returns over long periods, such as the declining real interest rate environment observed over the last 20 years, which is difficult to separate from inflation effects in traditional analyses.
In addition to analyzing each asset class individually, we also examine how several portfolios constructed from these asset classes respond to inflation and growth surprises.
The Effect of Inflation on the Performance of Major Asset Classes
To measure the historical effect of inflation and growth surprises (realizations that varied from expectations) we use inflation and industrial production market forecasts as reported by the Survey of Professional Forecasters. The actual measure compares annual inflation realizations to annual inflation forecasts lagged by a year. The measure is collected on a quarterly basis. We classified this data into four environments with the combination of positive (higher than expected) and negative (lower than expected) surprises to inflation and industrial production. We utilize industrial production surprises because the data is tracked monthly, fundamentally affects the real cost of capital, and is a proxy for the state of the business cycle.
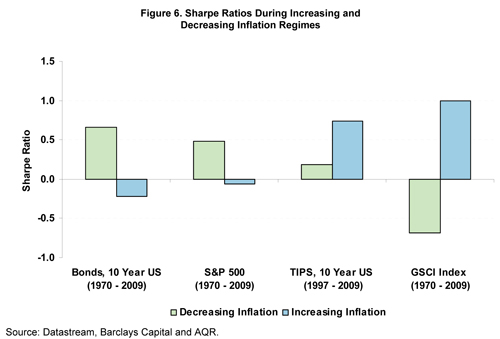
To examine the historical performance of each asset in different economic environments as defined by varying levels of inflation and growth (as opposed to inflation surprises), we classify inflation "regimes" according to the cross-section of increasing or decreasing levels of inflation and industrial production growth. We classify timeframes into increasing and decreasing inflation periods to examine how asset prices have responded historically in these distinct environments. Figure 1 depicts inflation and the various inflation regimes.
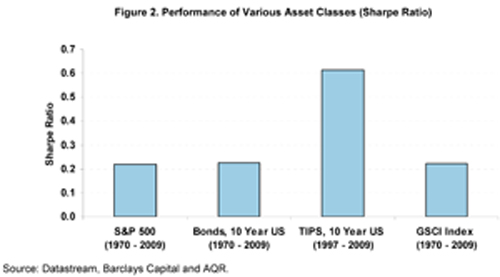
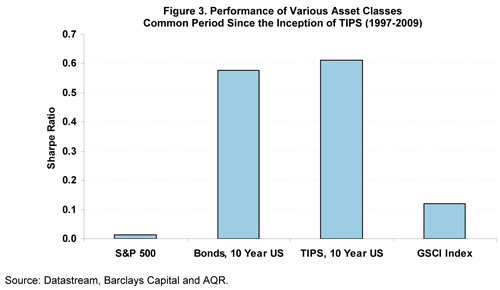
Looking at the full set of data for U.S. equity, U.S. Government Bonds, Commodities (GSCI Index) and TIPS, Figure 2 displays the risk-adjusted performance in excess of cash (Sharpe Ratio).10 We include data from 1970-2009 for stocks, bonds and commodities, but only from 1997 for TIPS since that is when they were first introduced. For purposes of comparison, we further display in Figure 3 the common period for all four assets (1997-2009). The results show that bonds and TIPS have performed exceptionally well, as real interest rates have consistently declined over the last twenty years.
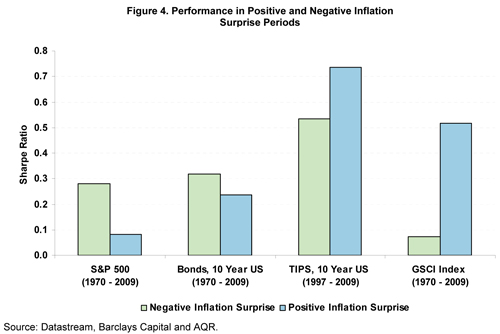
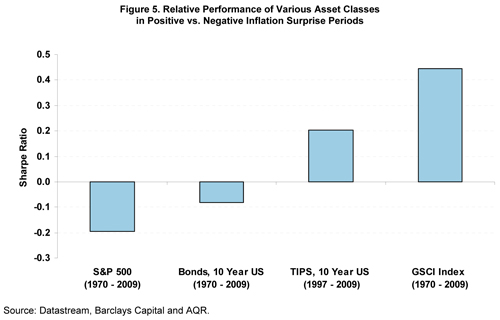
Turning our attention to performance based on inflation surprises, we focus on absolute performance in positive and negative surprise periods and the relative performance between the two environments. The results are presented in Figures 4 and 5. Commodities and TIPS performed well in periods of positive inflation surprise, while stocks and bonds lag. As can be seen in Figure 4, contrary to expectations, the absolute Sharpe Ratio of bonds has been positive in both positive and negative inflation surprise periods. We believe the historical positive performance of bonds in inflation surprises can be explained by the protracted decline in real rates over the last 20 years and the relatively moderate level of inflation surprises over this period. This illustrates the importance of relative performance (in Figure 5) when attempting to identify assets' sensitivity to inflation.