


Turning to Figure 11 and specific inflation regimes, we see that our theoretical framework is supported by the data with the exception of TIPS, which had flat performance during increasing inflation and decreasing growth periods. The TIPS results may be driven by their liquidity premium explored in Part I of this series; TIPS are historically less liquid than nominal bonds on the secondary market and therefore may suffer in a general de-risking environment associated with periods of recession, and simultaneously benefit from return to risk-seeking in expansionary growth periods. The importance of the liquidity premium has been declining since 2003 and may decline in the future as a result of an increase in both U.S. TIPS issuance and investors' interest in holding them. It is important to reiterate that the data in Figure 11 is limited by fewer data points than our inflation surprise analysis. Specifically, we observe few periods with increasing inflation and decreasing growth which limits the reliability of this traditional inflation analysis (which is one reason we previously focus on unexpected inflation changes).
Summary of Results: U.S. Equity, U.S. Government Bonds, TIPS, Commodities
One of the main drawbacks of traditional inflation analysis across stocks, bonds, commodities and TIPS is the limited number of observations in all inflation and growth environments, as well as the absence of data for some assets such as TIPS during stagflation. A benefit of our approach in examining both inflation regimes and inflation surprise data is the ability to observe multiple data points of asset performance in each inflation and growth environment. Furthermore, as we have pointed out in Section I, we argue it is unexpected changes in inflation and inflation expectations that directly leads to value gained - or lost - which we are directly measuring.
As suggested by our theoretical framework, equities have not been an efficient short- and medium-term inflation hedge as they have performed poorly following inflation surprises, even if accompanied by a surprise in positive economic growth. However, equities have performed exceedingly well in periods of a positive growth surprise and a negative inflation surprise, when other asset classes have under-performed. In line with expectations, government bonds did perform well in decreasing growth periods with decreasing inflation, as well as in periods of a negative growth surprise. TIPS have performed well in periods of a positive inflation surprise but also in periods of a negative growth surprise, as real yields decline. TIPS provide inflation protection and should perform well in periods of increasing inflation as well as periods of decreasing real rates, which tend to occur during recession. Commodities have been effective hedges against inflation, especially during periods of increasing growth.
Inflation and Strategic Asset Allocation
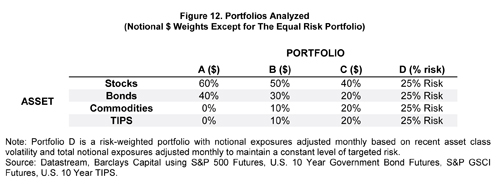
After examining how asset classes have performed in each inflation and growth regime individually, we turn our attention to asset allocation at the portfolio level. We will examine the traditional 60/40 stocks/bonds allocation as well as three more diversified portfolios using stocks, bonds, commodities and TIPS11. In two of the alternative portfolios we take an increasing percentage of capital from the 60/40 portfolio and allocate to commodities and TIPS12. The final alternative portfolio uses an equal-risk allocation across all four asset classes13.
Because unexpected inflation drives asset price changes we focus on inflation and growth surprises rather than performance of assets during increasing and decreasing inflation and growth regimes. The performance data during some of these regime scenarios is sparse, and TIPS did not exist during a stagflation since their 1997 introduction. This is reflected by the inconclusive results on TIPS using regime data in the previous section on asset class performance.
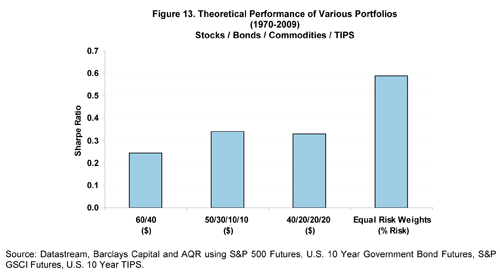
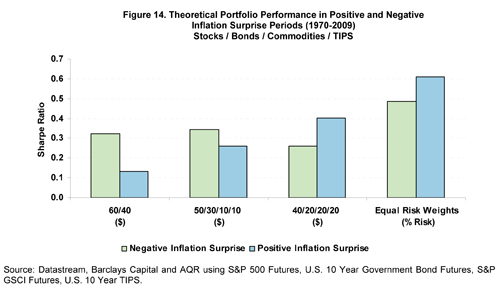
We start by considering the absolute performance of the four theoretical portfolios, presented in Figure 13. As the Figure shows there is very little difference in Sharpe Ratios across the first three equity-focused portfolios. The equal risk-weighted portfolio has performed significantly better with a Sharpe Ratio of approximately 0.6. This result is consistent with other studies of historical performance of risk-weighted or "risk parity" portfolios. This improvement in overall performance versus the capital weighted portfolios is due to better diversification by allocating more to lower-risk assets, maintaining diversification through time by rebalancing risk as assets or the market overall experiences changing volatility, and in part due to a higher allocation to TIPS which have had a strong relative performance (Sharpe Ratio) since inception. Figure 14 shows the relative performance of the various portfolios in negative and positive inflation surprise environments. As expected, the traditional 60/40 portfolio has performed well in negative inflation surprise environments when stocks and bonds outperform. However, a 60/40 has meager performance in positive inflation surprise environments as both assets are poorly hedged against inflation. Moving more weight to other asset classes improves the relative performance in positive surprise environments, albeit at the expense of giving up some performance in negative surprise environments. The equal risk-weighted portfolio, however, achieves better performance in positive inflation surprise environments without the associated drag on performance in negative inflation surprises. The relative performance of the equal risk-weighted portfolio in positive inflation surprise periods is higher than in negative surprise periods, suggesting that it provides better inflation hedging properties than the 60/40 portfolio. Furthermore, this portfolio has a more balanced performance across environments. The last point is important as investors are, therefore, taking less of a "bet" on the direction of inflation. As mentioned previously, relative performance in response to changes in unexpected inflation is a more meaningful measure of asset price sensitivity to inflation than examining performance during inflation regimes, since asset prices may have priced in changing inflation expectations before they first begin to materialize.
Consistent with our previous analysis of each asset class individually, Figure 15 considers how the four portfolios perform in each of the inflation and growth surprise scenarios. The 60/40 portfolio performs poorly during positive inflation surprises. Portfolio B and C, with allocations to commodities and TIPS, improved performance during inflationary periods. An equal risk-weighted portfolio improved performance in both inflationary and disinflationary periods as the diversification across both inflation hedging and growth allowed it to perform relatively well in each scenario. Referring back to Figure 9, this result is not theoretically surprising. Given a base-case assumption that each environment may be equally likely to occur on average, allocating 25% of a portfolio's risk to each asset class examined could be a reasonable approach to benefit from economic growth and serve as a potential hedge against the negative effects of inflation and/or recession.