Traditional asset allocation models seem obsolete. The much heralded “Endowment Model” failed in 2008, yet asset allocators continue to cling to it as much as the Peanuts character Linus hung on to his blanket. However, the global financial markets have changed dramatically, and the macroeconomic backdrop that fueled the success of the endowment approach no longer exists.
RBA’s approach, Asset Allocation 2.0, is based on a different asset allocation construct. We no longer pigeonhole investments into traditional categories, such as Large Growth or Value, Small Growth or Value, High Yield or Distressed debt, Absolute Return, or the like. Rather, we group investments based on their returns and risk characteristics.
To our clients, Asset Allocation 2.0 looks no different from traditional asset allocation. Our external reports show exposures to traditional asset categories. Internally at RBA, however, we view asset classes very differently. An investment doesn’t necessarily belong in a fixed-income category if it acts more like an equity investment than a fixed-income investment. An equity investment shouldn’t be characterized as equity if it acts more like a fixed-income investment than an equity investment. Similarly, an alternative investment shouldn’t be classified as alternative if it acts like traditional equity or fixed-income.
Asset Allocation 2.0 also incorporates the productivity of an investment. Productivity does not mean efficiency in an efficient frontier analysis. Rather, it means incorporating a cost/benefit analysis. Fees and lock-ups make little sense when similar exposures can be gained in investments without onerous terms.
This report is not meant to change the asset allocation world. We want investors to gain greater insight as to how RBA determines the asset allocation strategies within our portfolios. We continue to believe RBA’s unique and dynamic approach to asset allocation, Asset Allocation 2.0, is likely to outperform today’s accepted strategies on a risk-adjusted basis through time.
C’mon, admit it already: The Endowment Model failed
Today’s asset allocation models largely follow the so-called Endowment Model despite that the strategy largely failed in 2008. Assets that were supposed to provide diversification suffered significant losses along with the stock market. The combination of a lack of true diversification and significant asset illiquidity forced investors to meaningfully alter or defer spending plans. For example, some large universities that followed the Endowment Model approach were forced to issue debt (effectively leveraging their endowments) in order to maintain the basic cash flows necessary to fund operations. Some foundations similarly had to limit or postpone grant spending.
Many state and local pension funds that invested using the Endowment Model became significantly underfunded. Yet, despite 2008’s flop, adherents of the Endowment Model continue to search for even more esoteric and even more illiquid investments that often offer minimal expected return or diversification benefits.
The reality is that 2008’s asset allocation debacle could have been mitigated or maybe even prevented. Although Asset Allocation 2.0 did not formally exist in 2008, the early research behind it (as far back as March 2006’s report “Uncorrelated Assets are Now Correlated”) suggested investors were ignoring the Endowment Model’s profound shortcomings.
The macroeconomic environment was critical to the Endowment Model’s success.
As a macro-based firm, RBA believes that the macroeconomy drives asset performance. Although some stock and bond pickers claim to ignore macroeconomic events and only look at company fundamentals, we think they do so at their own peril. Nearly 25 years ago, our work clearly showed that the macro-environment greatly affects the performance of asset classes, size, style, risk and quality.
The macroeconomic environment also seems to have been the main factor driving the success of the Endowment Model. Our caution today toward the Endowment Model approach is based on our view that the global economy is going through a significant metamorphosis (namely the deflation of the global credit bubble) that challenges some of the major tenets within Endowment Model strategies.
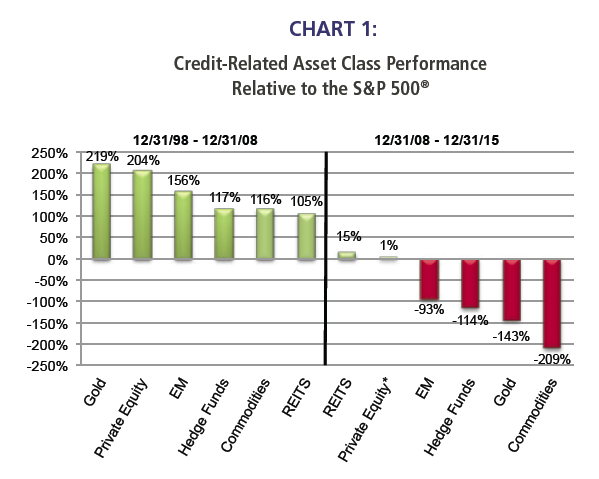
Chart 1 shows the relative performance of credit-related asset classes versus the S&P 500 from 1998 to 2008, which was the period during which the global credit bubble inflated. Credit-related asset classes uniformly outperformed stocks during this period. Credit-related asset classes are those asset classes that have the greatest sensitivity to credit creation, and that sensitivity proved to be a huge fillip to asset performance during the credit bubble.
However, credit-related asset classes have underperformed equities since the credit bubble started to deflate in 2008. These asset classes’ sensitivity to credit creation, which aided performance from 1998 to 2008, is now detracting from performance as the global credit bubble deflates.
*Private Equity Performance available through 12/31/15.
Source: Richard Bernstein Advisors LLC, MSCI, Standard & Poors, BofA Merrill Lynch, Bloomberg Finance
L.P., Cambridge Associates, HFRI. For Index descriptors, see "Index Descriptions" at end of document.
The core of the Endowment Model focuses on many of these credit-related asset classes. Hedge funds, private equity, real estate, commodities, and emerging markets, for example, are all credit-related asset classes. Although each asset class has had short periods of outperformance since the deflation of the global credit bubble began, they have secularly underperformed. Thus, much of the Endowment Model’s historical success can be tied to the secular inflation of the global credit bubble. The secular deflation of the global credit bubble could lead to secular underperformance.
If it quacks like a duck and walks like a duck, then it’s correlated to a duck.
Asset Allocation 2.0 questions why investors would invest in a broad range of asset categories that ultimately are positively correlated with each other. Wouldn’t it make more sense to invest in fewer asset classes that are uncorrelated or negatively correlated?
Correlation is probably the most manipulated statistic in all of investment management. One can manipulate correlation statistics to give virtually any desired result if one changes the periodicity of the returns, the time horizon, or the historical period studied.
Because of the vagaries of correlation statistics, we use secular correlations within Asset Allocation 2.0. Our measures change through time, but are relatively stable for shorter intervals. That allows us to better gauge the potential diversification benefits of an asset class, and whether such benefits may be fleeting.
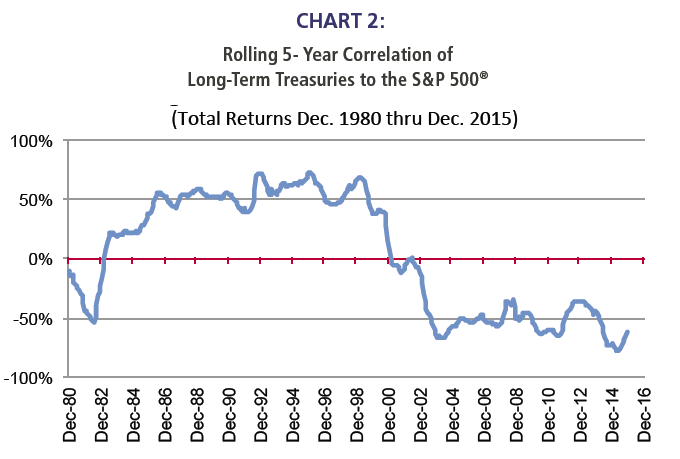
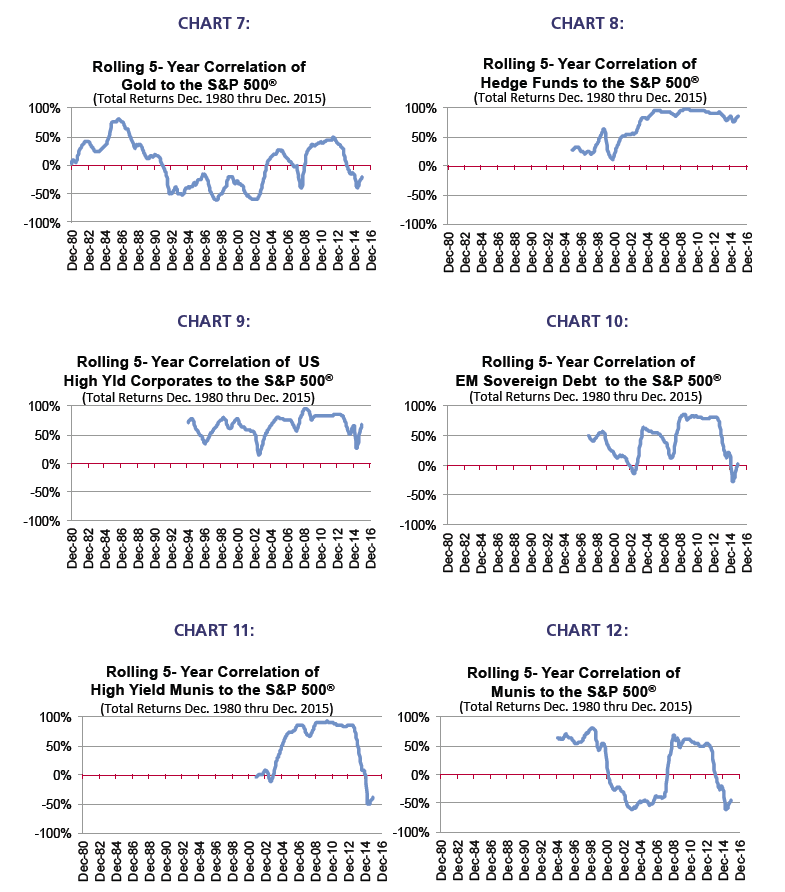
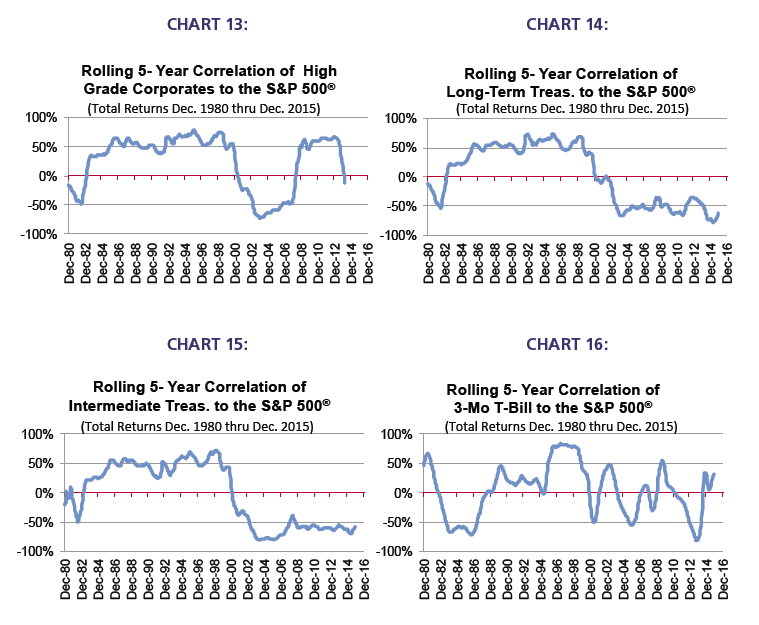
Chart 2 shows the historical correlation relationship between long-term Treasury bonds and the S&P 500. During the 1980s and much of the 1990s, stocks and treasuries were positively correlated, and traditional stock/bond/cash asset allocation offered little diversification. The search began for an “alternative” framework, and the Endowment Model was born. However, the correlation between stocks and treasuries turned negative during the mid-2000s, which suggested that basic stock/ bond/cash asset allocation might again prove fruitful.
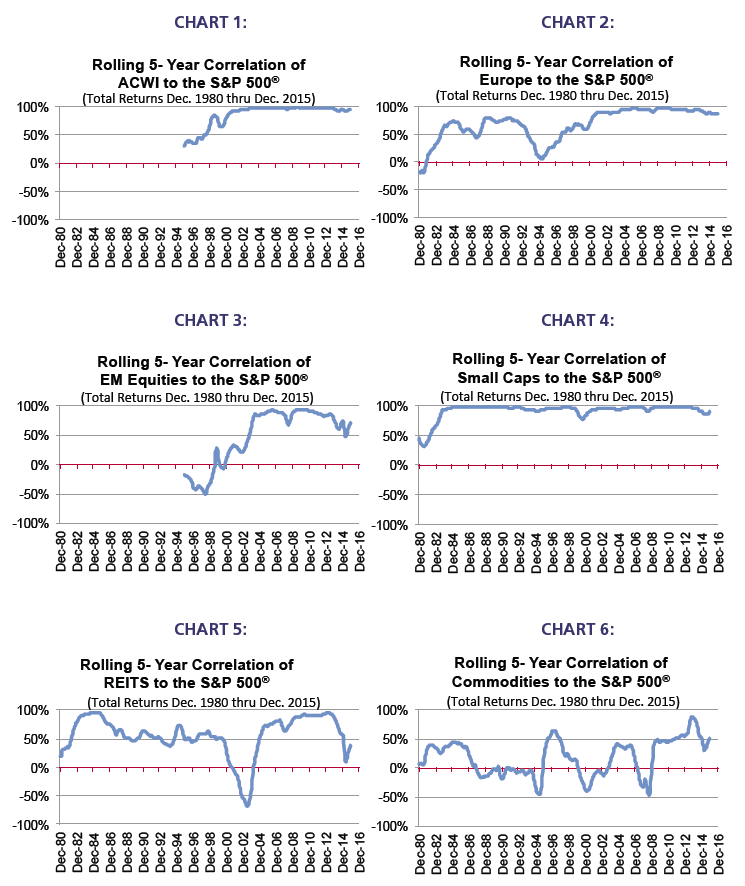
The 2008 debacle could have easily been ameliorated, at least to some extent if not completely, if investors had realized that 1) asset correlations were significantly different than investors believed, 2) supposed non-correlated assets had become highly correlated with stocks, and 3) blasé treasuries could be a major source of diversification and muted volatility. A full set of secular correlation charts are in the Appendix.
Source: Richard Bernstein Advisors LLC, Standard & Poors, BofA Merrill Lynch, Bloomberg Finance L.P.
For Index descriptors, see "Index Descriptions" at end of document.
Our correlation analyses allow us to invest in asset classes based on their returns’ characteristics and not the asset class names or categories. The traditional boundaries between asset classes are meaningless within our framework.
A spectrum of sensitivities
Asset Allocation 2.0 looks at assets’ sensitivity to factors such as profitability, liquidity, quality, and others regardless of how an asset might be categorized in a traditional sense. The schematic below portrays a simple way to consider the importance of such sensitivities. The diagram shows a spectrum from “pure fixed-income,” which we arbitrarily define as US Treasuries based on an assumption that investors are US dollar-based, to “pure equity”, which we define as small capitalization stocks or venture capital.
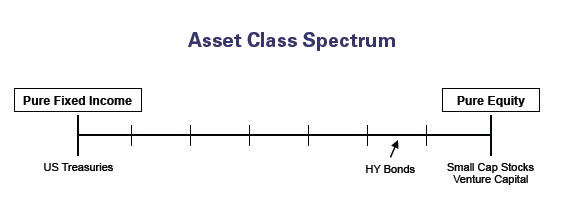
Each asset class can be placed on the spectrum depending on its equity or fixed-income sensitivity. For example, high yield corporate bonds often show characteristics that are more equity-sensitive than fixed-income sensitive despite that many investors categorize high yield or “distressed” debt investing as fixed-income or absolute/independent return.
Chart 3 briefly shows why this is the case for high yield bonds. The chart shows asset class correlation to equities measured against sensitivity to equity movement (beta). An asset class might have a high correlation to equities, meaning that its returns move in tandem with equity returns, but might have a low beta, which suggests that the movements although aligned are muted relative to equity returns. One can see that is indeed the case for high yield bonds. Ignoring expected returns, this chart argues that if an investor is interested in high yield bonds, it might be more productive to invest in equities. High yield returns are highly correlated with equity returns, but have a lower beta. Thus, it would be odd to favor high yield, but be bearish on public equities.

Source: Richard Bernstein Advisors LLC, Standard and Poor's, HFRI, Cambridge
Associates, MSCI, BofA Merrill Lynch, Bloomberg Finance L.P. For Index descriptors,
see "Index Descriptions" at end of document
Of course, the relationships shown in Chart 3 and depicted in the schematic are dynamic, and must be monitored through time. However, the important aspect is that asset classes should not be grouped according to traditional pigeonhole descriptions and allocation models. Whether one is examining stocks, bonds, hedge funds, private equity, venture capital, or non-US stocks and bonds, the important consideration is not what box to fill in an allocation table. Rather, it is what sensitivity one wants to exploit and what is the most cost effective way to gain that sensitivity.
Conclusions
➜ The so-called Endowment Model failed in 2008, yet investors continue to cling to the framework and ignore that the macroeconomic backdrop that fueled much of the Endowment Model’s success has significantly changed.
➜ Asset Allocation 2.0 is a different method for allocating assets. Rather than relying on traditional asset categories, it seeks to exploit sensitivities or characteristics within the global financial markets.
➜ Traditional correlation analyses can be manipulated and should be used judiciously. Secular correlations seem much more useful.
➜ There is a spectrum of sensitivities. Investors need to judge the cost/benefit of gaining exposures to those sensitivities.
➜ Asset Allocation 2.0 is a dynamic process that removes the traditional asset allocation boundaries to search for the most effective way to gain factor exposure.
If you would like to learn more about RBA’s Asset Allocation 2.0, please contact your RBA Portfolio Specialist.
Source: Richard Bernstein Advisors LLC, Standard & Poors, BofA Merrill Lynch, HFRI, MSCI, Bloomberg Finance L.P.
For Index descriptors, see "Index Descriptions" at end of document.
INDEX DESCRIPTIONS:
The following descriptions, while believed to be accurate, are in some cases abbreviated versions of more detailed or comprehensive definitions available from the sponsors or originators of the respective indices. Anyone interested in such further details is free to consult each such sponsor’s or originator’s website.
The past performance of an index is not a guarantee of future results.
Each index reflects an unmanaged universe of securities without any deduction for advisory fees or other expenses that would reduce actual returns, as well as the reinvestment of all income and dividends. An actual investment in the securities included in the index would require an investor to incur transaction costs, which would lower the performance results. Indices are not actively managed and investors cannot invest directly in the indices.
Gold: Gold Spot USD/oz Bloomberg GOLDS Commodity. The Gold Spot price is quoted as US Dollars per Troy Ounce.
Commodities: S&P GSCI Index.The S&P GSCIR seeks to provide investors with a reliable and publicly available benchmark for investment performance in the commodity markets, and is designed to be a “tradable” index. The index is calculated primarily on a world production-weighted basis and is comprised of the principal physical commodities that are the subject of active, liquid futures markets.
REITS: THE FTSE NAREIT Composite Index. The FTSE NAREIT Composite Index is a free-float-adjusted, market-capitalization-weighted index that includes all tax qualified REITs listed in the NYSE, AMEX, and NASDAQ National Market.
Hedge Fund Index: HFRI Fund Weighted Composite Index. The HFRI Fund Weighted Composite Index is a global, equal-weighted index of over 2,000 single-manager funds that report to the HFR (Hedge Fund Research) database. Constituent funds report monthly net-of-all-fees performance in USD and have a minimum of $50 million under management or a twelve (12)-month track record of active performance. The Index includes both domestic (US) and offshore funds, and does not include any funds of funds.
Private Equity: The Cambridge Associates LLC U.S. Private Equity Index. The Cambridge Associates LLC U.S. Private Equity Index is an end-to-end calculation based on data compiled from 986 U.S. private equity funds (buyout, growth equity, private equity energy and mezzanine funds), including fully liquidated partnerships, formed between 1986 and 2012. Pooled end-to-end return, net of fees, expenses, and carried interest. Historic quarterly returns are updated in each year-end report to adjust for changes in the index sample.
S&P 500: Standard & Poor’s (S&P) 500 Index. The S&P 500 Index is an unmanaged, capitalization-weighted index designed to measure the performance of the broad US economy through changes in the aggregate market value of 500 stocks representing all major industries.
U.S. Small Caps: Russell 2000 Index. The Russell 2000 Index is an unmanaged, capitalization-weighted index designed to measure the performance of the small-cap segment of the US equity universe. The Russell 2000 Index is a subset of the Russell 3000 Index.
ACWI: MSCI All Country World Index (ACWI). The MSCI ACWIR Index is a widely recognized, free-float-adjusted, market capitalization-weighted index designed to measure the equity-market performance of developed markets.
Europe: MSCI Europe Index. The MSCI Europe Index is a free-float-adjusted, market-capitalization-weighted index designed to measure the equity-market performance of the developed markets in Europe. The MSCI Europe Index consists of the following 16 developed market country indices: Austria, Belgium, Denmark, Finland, France, Germany, Greece, Ireland, Italy, the Netherlands, Norway, Portugal, Spain, Sweden, Switzerland, and the United Kingdom.
Japan: MSCI Japan Index. The MSCI Japan Index is a free-float adjusted, market-capitalization-weighted index designed to measure the equity-market performance of Japan.
3-Mo T-Bills: BofA Merrill Lynch 3-Month US Treasury Bill Index. The BofA Merrill Lynch 3-Month US Treasury Bill Index is comprised of a single issue purchased at the beginning of the month and held for a full month. The Index is rebalanced monthly and the issue selected is the outstanding Treasury Bill that matures closest to, but not beyond, three months from the rebalancing date.
Long-term Treasury Index: BofA Merrill Lynch 15+ Year US Treasury Index. The BofA Merrill Lynch 15+ Year US Treasury Index is an unmanaged index comprised of US Treasury securities, other than inflation-protected securities and STRIPS, with at least $1 billion in outstanding face value and a remaining term to final maturity of at least 15 years.
Intermediate Treasuries (5-7 Yrs). The BofA Merrill Lynch 5-7 Year US Treasury Index The BofA Merrill Lynch 5-7 Year US Treasury Index is a subset of The BofA Merrill Lynch US Treasury Index (an unmanaged Index which tracks the performance of US dollar denominated sovereign debt publicly issued by the US government in its domestic market). Qualifying securities must have at least one year remaining term to final maturity, a fixed coupon schedule and a minimum amount outstanding of $1 billion, including all securities with a remaining term to final maturity greater than or equal to 5 years and less than 7 years.
Municipals: BofA Merrill Lynch US Municipal Securities Index. The BofA Merrill Lynch US Municipal Securities Index tracks the performance of USD-denominated, investment-grade rated, tax exempt debt publicly issued by US states and territories (and their political subdivisions) in the US domestic market. Qualifying securities must have at least one year remaining term to final maturity, a fixed coupon schedule, and an investment-grade rating (based on an average of Moody’s, S&P and Fitch). Minimum size requirements vary based on the initial term to final maturity at the time of issuance.
High Grade Corporates: BofA Merrill Lynch 15+ Year AAAAA US Corporate Index. The BofA Merrill Lynch 15+ Year AAA-AA US Corporate Index is a subset of the BofA Merrill Lynch US Corporate Index (an unmanaged index comprised of USD-denominated, investment-grade, fixed-rate corporate debt securities publicly issued in the US domestic market with at least one year remaining term to final maturity and at least $250 million outstanding) including all securities with a remaining term to final maturity of at least15 years and rated AAA through AA3, inclusive.
U.S. High Yield: BofA Merrill Lynch US Cash Pay High Yield Index. The BofA Merrill Lynch US Cash Pay High Yield Index tracks the performance of USD-denominated, below-investment grade-rated corporate debt, currently in a coupon-paying period, that is publicly issued in the US domestic market. Qualifying securities must have a below-investment-grade rating (based on an average of Moody’s, S&P and Fitch) and an investment-grade-rated country of risk (based on an average of Moody’s, S&P and Fitch foreign currency long-term sovereign debt ratings), at least one year remaining term to final maturity, a fixed coupon schedule, and a minimum amount outstanding of $100 million.
EM Sovereign: The BofA Merrill Lynch US Dollar Emerging Markets Sovereign Plus Index. The BofA Merrill Lynch US Dollar Emerging Markets Sovereign Plus Index tracks the performance of US dollar denominated emerging market and cross-over sovereign debt publicly issued in the Eurobond or US domestic market. Qualifying countries must have a BBB1 or lower foreign currency long-term sovereign debt rating (based on an average of Moody’s, S&P and Fitch). Countries that are not rated, or that are rated “D” or “SD” by one or several rating agencies qualify for inclusion in the index but individual nonperforming securities are removed. Qualifying securities must have at least one year remaining term to final maturity, a fixed or floating coupon and a minimum amount outstanding of $250 million. Local currency debt is excluded from the Index.
About Richard Bernstein Advisors
Richard Bernstein Advisors LLC is an independent investment adviser. RBA's investment insights as well as further information about the firm and products can be found at www.RBAdvisors.com.