


Chart 2 shows the historical correlation relationship between long-term Treasury bonds and the S&P 500. During the 1980s and much of the 1990s, stocks and treasuries were positively correlated, and traditional stock/bond/cash asset allocation offered little diversification. The search began for an “alternative” framework, and the Endowment Model was born. However, the correlation between stocks and treasuries turned negative during the mid-2000s, which suggested that basic stock/ bond/cash asset allocation might again prove fruitful.
The 2008 debacle could have easily been ameliorated, at least to some extent if not completely, if investors had realized that 1) asset correlations were significantly different than investors believed, 2) supposed non-correlated assets had become highly correlated with stocks, and 3) blasé treasuries could be a major source of diversification and muted volatility. A full set of secular correlation charts are in the Appendix.
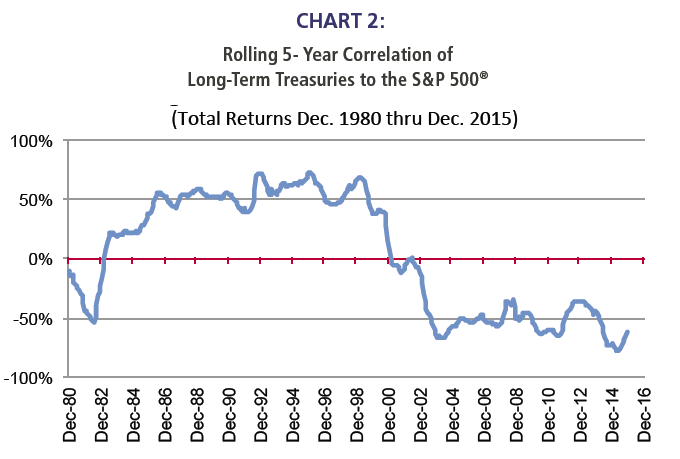
Source: Richard Bernstein Advisors LLC, Standard & Poors, BofA Merrill Lynch, Bloomberg Finance L.P.
For Index descriptors, see "Index Descriptions" at end of document.
Our correlation analyses allow us to invest in asset classes based on their returns’ characteristics and not the asset class names or categories. The traditional boundaries between asset classes are meaningless within our framework.
A spectrum of sensitivities
Asset Allocation 2.0 looks at assets’ sensitivity to factors such as profitability, liquidity, quality, and others regardless of how an asset might be categorized in a traditional sense. The schematic below portrays a simple way to consider the importance of such sensitivities. The diagram shows a spectrum from “pure fixed-income,” which we arbitrarily define as US Treasuries based on an assumption that investors are US dollar-based, to “pure equity”, which we define as small capitalization stocks or venture capital.
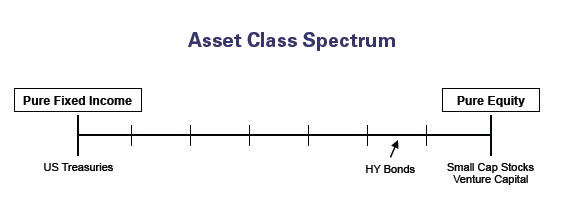
Each asset class can be placed on the spectrum depending on its equity or fixed-income sensitivity. For example, high yield corporate bonds often show characteristics that are more equity-sensitive than fixed-income sensitive despite that many investors categorize high yield or “distressed” debt investing as fixed-income or absolute/independent return.
Chart 3 briefly shows why this is the case for high yield bonds. The chart shows asset class correlation to equities measured against sensitivity to equity movement (beta). An asset class might have a high correlation to equities, meaning that its returns move in tandem with equity returns, but might have a low beta, which suggests that the movements although aligned are muted relative to equity returns. One can see that is indeed the case for high yield bonds. Ignoring expected returns, this chart argues that if an investor is interested in high yield bonds, it might be more productive to invest in equities. High yield returns are highly correlated with equity returns, but have a lower beta. Thus, it would be odd to favor high yield, but be bearish on public equities.

Source: Richard Bernstein Advisors LLC, Standard and Poor's, HFRI, Cambridge
Associates, MSCI, BofA Merrill Lynch, Bloomberg Finance L.P. For Index descriptors,
see "Index Descriptions" at end of document
Of course, the relationships shown in Chart 3 and depicted in the schematic are dynamic, and must be monitored through time. However, the important aspect is that asset classes should not be grouped according to traditional pigeonhole descriptions and allocation models. Whether one is examining stocks, bonds, hedge funds, private equity, venture capital, or non-US stocks and bonds, the important consideration is not what box to fill in an allocation table. Rather, it is what sensitivity one wants to exploit and what is the most cost effective way to gain that sensitivity.