This is how the stock market works:
“Once upon a time in a village, a man appeared and announced to the villagers that he would buy monkeys for $10 each. The villagers, seeing that there were many monkeys around, went out to the forest and started catching them. The man bought thousands at $10, and as supply started to diminish, the villagers stopped their effort. He further announced that he would now buy at $20. This renewed the efforts of the villagers and they started catching monkeys again. Soon the supply diminished even further, and people started going back to their farms. The offer increased to $25 each, and the supply of monkeys became so little that it was an effort to even see a monkey, let alone catch it!
The man now announced that he would buy monkeys at $50! However, since he had to go to the city on some business, his assistant would now buy on behalf of him. In the absence of the man, the assistant told the villagers, ‘Look at all these monkeys in the big cage that the man has collected. I will sell them to you at $35 and when the man returns from the city, you can sell them to him for $50 each.’ The villagers rounded up with all their savings and bought all the monkeys. Then they never saw the man nor his assistant, only monkeys everywhere!
Now you have a better understanding of how the stock market works.”
. . . Author unknown
Well, according to the Chinese calendar, 2016 is the year of the monkey, the red monkey to be exact. The Chinese day of the Red Monkey begins on February 8, Chinese New Year’s Day. To quote “The Chinese Fortune Calendar:”
“According to Chinese Five Elements Horoscopes, Monkey contains Metal and Water. Metal is connected to gold. Water is connected to wisdom and danger. Therefore, we will deal with more financial events in the year of the Monkey. Monkey is a smart, naughty, wily and vigilant animal. If you want to have good return for your money investment, then you need to outsmart the Monkey. Metal is also connected to the Wind. That implies the status of events will be changing very quickly. Think twice before you leap when making changes for your finance, career, business relationship and people relationship.”
“Get the monkey off of my back” was the cry from money managers at the end of 2015, as most of them underperformed the indices. That’s a pretty unbelievable factoid given the S&P 500 was down a mere 0.73%. I guess if you were a “momentum monkey,” owning just the FANGs (Facebook, Amazon, Netflix, Google), you had a fairly good year. As Goldman Sachs notes, “FANGs comprise 20% of the Nasdaq 100 and 5.5% of the S&P 500 [and they] contributed +3.5% of performance to S&P’s performance (or lack thereof) this year.” Goldman goes on to write, “Six of the top 10 best performing stocks in the S&P 500 are TMT stocks (Telecommunication, Media, Technology). There is only one TMT stock in the bottom 10 S&P performers on the year (Micron).”
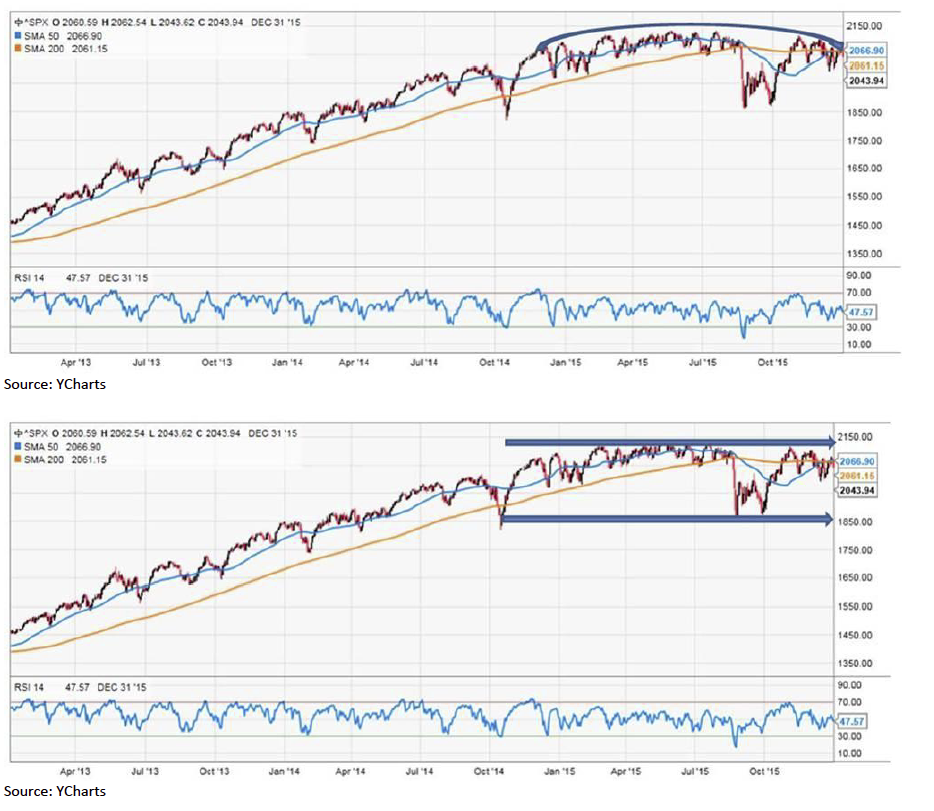
To be sure, it has been a very frustrating year for most, but keep the faith, because typically following a flat year (no more than +/- 5%), the next year has been a good one for stocks. Since 1980, such “flat years” have occurred seven times, and in six of those seven times, the S&P 500 was higher the following year 86% of the time with the exception being 2008. While on CNBC last week, debating with a negative nabob who was discussing the internal deterioration of stocks, I said that I agree. However, in rotating the prism 180%, one can make the case that, with 47% of Lowry’s Operating Companies Only (OCO) universe of stocks down 20% (or more) from their respective 52-week highs (read: internal deterioration), there is an argument to be made that many stocks have already been through a bear market. So while the bears look at a long-term chart of the SPX and see a “broadening top” (chart 1), the bulls look at the same chart and see a yearlong consolidation following an over 200% rally (chart 2).
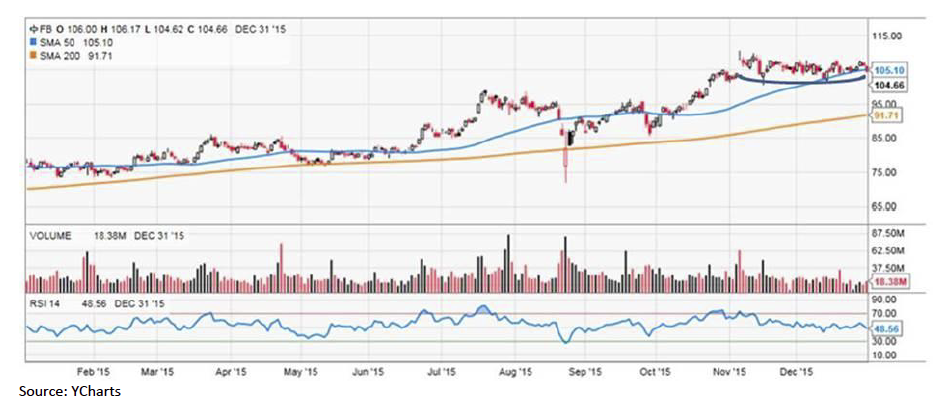
The same can be said about some individual stocks; Facebook (FB/$104.66/Outperform) is an example. Facebook has effectively gone sideways since its peak in early November. The “bears” look at the chart and see a broadening top. The “bulls” see a consolidation and think FB is getting ready to breakout to the upside (chart 3). I had lunch with my friend Tom O’Halloran recently. Tom is the portfolio manager for Lord Abbett’s “Growth Leaders Fund” (LGLAX/$22.49), a fund that I own. Tom turned me on to FB when it was in the $20s, suggesting that per click advertising fees they were getting from businesses was going to increase dramatically. Raymond James’ fundamental analysts agree, and on November 4, wrote:
“Facebook reported a strong 3Q marked by 57% y/y forex neutral ad revenue growth, 72% y/y mobile revenue growth, and solid engagement trends (daily average user growth of 17% y/y). Facebook also noted strength from newer ad formats and platforms, including carousel ads, dynamic product ads, videos, and Instagram. We reiterate our Outperform rating and increase our price target … as we expect: 1) continued strength in user growth across platforms; 2) increasing advertiser demand and ad relevance to drive pricing; 3) increasing monetization from newer platforms (i.e., Instagram).”
So last week began with a whimper on Monday (-24 Dow points), we had a BANG on Tuesday (+192 points), gave some of it back on Wednesday (-117), and then Thursday erased everything (-178). For the week, the D-J Industrials (INDU/17425.03) surrendered 0.72%, leaving it down 2.2% for 2015. The S&P 500 (SPX/2043.95) did a little worse, shedding 0.83%, capping a year to date loss of 0.7%. However, when dividends are included, the SPX was up 1.4% on the year. In fact, ALL of the indices we monitor were down for the holiday shortened week. The best performing indexes for 2015 were the NASDAQ Composite (+5.73%) and the NASDAQ 100 (+8.3%). The worse performing index for the year was the D-J Transportation Average (TRAN/7508.710), which fell 17.85%. The action of the Transports has been diverging from the Industrials since late last year. Said action elicited this prose form the Birmingham, AL based The Collier Group’s investment analyst Mick St. Amour:
“Many market participants [are] asking themselves is the market about to rollover or was 2015 more of consolidation year for equities? You see, when you look at the most recent action of the Dow Jones Industrials versus the Dow Transports, a bull will tell you that we have a downside non confirmation with the transports, while a bear will say that we have an upside non confirmation with the Dow. No wonder so many folks are coming into 2016 confused because there are market indicators that are giving us conflicting signals. But, if I had to make a call on fundamentals alone, I suspect that 2016 will be a lot like 2015 in some ways and different in others.”
The call for this week: Obviously, my call for a “rip your face off rally” from the December low of ~1994 for the SPX was a bad “call.” In fact, the typical “Santa Rally” didn’t show up either, but parsing the data shows that doesn’t necessarily mean bad stock market performance in 2016. Indeed, according the insightful folks at Ned Davis research, “Of the 35 bear markets (since 1900); only 12 of them have occurred following failed ‘Santa Clause’ rallies.” Ladies and gentlemen, that’s a success factor of only 34%. Nevertheless, Santa failed to call in 2015, making my call for a year-end rally just plain wrong.
In this business, when you are wrong, you say you are wrong and move on. Manifestly, if you take a stand, and make a call, you are going to be wrong at best about one-third of the time, yet most pundits never admit they have made a bad call. And that bad call is extending this morning with the preopening S&P 500 futures off another 30 points on renewed Chinese growth fears, as China’s stock market slumped 7% overnight and trading was suspended. The action suggests yet another downside test of the S&P’s 1990 to 2000 support zone.
Jeffrey Saut is chief investment strategist at Raymond James.