


The lingering effects of the financial crisis and the subsequent global economic slowdown have resulted in a paradigm shift for global companies. Asia and the Asian consumer have become increasingly important, given the prospects for growth in the region. As evidence of the opportunity, corporations have made significant commitments in the region. BASF recently announced plans to invest 2 billion euros ($2.7 billion) in its plants in Asia by 2014 with approximately half of that dedicated to plants in China. Roche, Europe's leading drug maker, has sales of more than $1 billion in China. Citigroup generated 37% of its profits from Asia year to date through September 2010 versus 17% in 2006, and has plans to double its workforce in China over the next three years. Procter & Gamble has doubled the percentage of total sales in Asia from 7% in 2002 to 15% in 2010. Sales in China represented 14% of total revenues in 2005 for Yum Brands, the world's largest restaurant company, and now are 35%. Furthermore, the company plans to open another 475 new restaurants in China in addition to its existing base of 3,700 units.
As investors, we are excited about the opportunities in the region. The increasing consumption trends in Asia are likely in their infancy and may last over the next 10 to 20 years as increased urbanization and the increasing wealth of the population in the region will drive greater consumption of consumer goods.
The Asian Consumer - Attractive Fundamentals
The recent financial crisis continues to affect developed nations. Unemployment in the U.S. remains stubbornly high at just under 10%, with what appears to be minimal job growth in the near future. Europe is dealing with a number of challenges as well: a banking crisis and bailout in Ireland; high unemployment and steep declines in property values in Ireland and Spain; a pending tax increase in the UK; and ongoing fiscal imbalances in Greece.
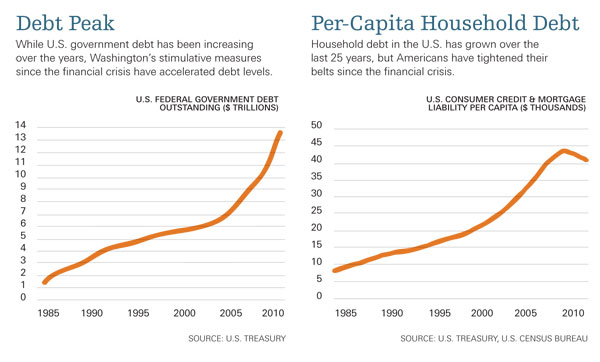
Additionally, in order to spur growth, governments have employed Keynesian measures by increasing spending and extending social benefits such as unemployment coverage. While these actions have likely softened the decline in GDP in these regions, they have added significantly to national debt levels. At some point, the bill for this spending will eventually come due. As the chart above left shows, U.S. government debt has risen 50% or 4.5 trillion since 2007.
Consumer debt has most recently been trending downward as individuals have increased their savings and reduced their outstanding liabilities by paying down mortgages and credit card balances. However, the outstanding debt balance is still quite significant on a nominal basis. The chart above right shows total household debt on a per-capita basis over the last 25 years.
Consumption in the U.S. and Europe has rebounded from the lows during the financial crisis, but we have not yet approached pre-recession levels in such industries as automobile sales and retail sales. For example, auto sales in the U.S. were 16.5 million in 2007, dropping to 10.6 million in 2009 and were 11.5 million in 2010. U.S. retail sales ex. autos peaked at $3.96 trillion in 2008 and are estimated to be $3.92 trillion in 2010, approximately 1% below the peak. Within total retail sales, clothing sales in the U.S. topped $221 billion in 2007, but fell to $208 billion in 2009, a decline of 6%. Auto sales in Western Europe peaked at 15.6 million in 2007 and were approximately 13.0 million in 2010. Retail sales in the UK have also declined and are at levels last seen in 2005.
Clearly, developed regions are now left with significant fiscal and personal debt, which will most likely result in future payback via reduced social and retirement benefits and/or higher taxes on both individuals and corporations. As a result, consumer discretionary spending may be constrained in the future.
The circumstances for the consumer in developing regions are quite the opposite. First, fiscal overhang is minimal. For example, in Korea government debt is 32% of GDP, in Indonesia it is 27%, and in China it is just 14%, according to the International Monetary Fund. Those numbers compare quite favorably to the U.S.'s debt ratio of 92%. In addition, all three of these Asian countries are running current account surpluses in 2010.
Second, personal savings rates are generally high in Asian countries. China's savings rate has been estimated to be over 50% of its income. Granted, social programs such as Social Security or unemployment coverage are not as developed in China as they are in Europe and the U.S., so there is greater impetus for Asian families to save more.
Even so, the consumer in Asia is not burdened with a high level of personal debt or the overhang of potentially higher taxes due to fiscal spending. While there are still ongoing opportunities in developed regions, the fundamentals of the Asian consumer are extremely attractive.
Drivers Of Asian Consumption
On a forward-looking basis, there are three significant drivers of consumption in the region: 1) Greater urbanization rates and rising personal disposable incomes in countries like China; 2) a growing population of high net worth individuals in Asia; and 3) the law of large numbers as it applies to China, a country of 1.3 billion people. Let's review each of these drivers in turn.
I. Urbanization and disposable income
China's urbanization rate as a percent of its population has steadily increased from 20% in the late 1970s to 47% today (bottom left chart). By comparison, approximately 79% of the total population in the U.S. lives in urban areas, a figure that has not changed much over the past 30 years. Urbanization rates in China may never approach the level of the U.S., but with approximately 1% of China's population moving into cities annually, this amounts to 13 million people per year who are relocating to urban areas. If this rate persists, in approximately 20 years a population equal to that of the entire U.S. will move into cities within China-and still, urbanization rates would be below 70%.
As individuals migrate from the farm to the city, they typically obtain manufacturing jobs and corporate occupations that are higher-paying than careers in rural areas. According to the Chinese National Bureau of Statistics, in 2008, the average Chinese rural worker earned 4,750 yuan, while their urbanite counterparts took home 15,750 yuan, more than three times that amount.
There's another dynamic at work here: disposable incomes in urban areas are themselves rising. As shown in the chart below right, the disposable personal income of an urban resident in China on a per-capita basis has grown at an annual rate of nearly 12% since 2000. Rising wages have resulted in greater disposable income and greater consumption of consumer goods.
Today, China has 36 cities with a population of at least 2 million, versus the U.S. at 21, according to the China Statistical Bureau. Similarly, there are 136 cities in China with a population of 500,000 or greater while the U.S. has just 66. As urbanization rates increase, new cities will be formed and both incomes and consumption are likely to increase. The need for infrastructure, housing and mass transit as well as the increased demand for consumer goods is and will likely be significant.
II. Millionaires in China
In 2009, the number of high-net-worth individuals (HNWI, defined as having a net worth greater than $1 million) in China was estimated to be around 477,000, according to the Cap Gemini Merrill Lynch 2010 World Wealth Report. With a population of 1.3 billion individuals, the HNWI population in China is under 0.04% of the total. In contrast, the U.S. has 2.9 million HNWI out of a population of approximately 310 million, or approximately 1%. If 1% of China's population become HNWI, that would translate into 13 million HNWI in the country based upon current numbers. Even if the number of millionaires in China doubles from current levels, the HNWI population in the country will still only represent less than 0.1% of the total. No matter the pace of growth in HNWI, there is no question that the rising affluent class will change the texture of consumption growth going forward.
The expansion of the millionaire population is not confined to China. In fact, Cap Gemini projects that from 2008 to 2018, HNWI wealth in Asia will grow at an annual rate of 8.8% versus the global average annual rate of 7.1%.

III. The law of large numbers
The discussion about millionaires illustrates a general point: the enormity of China's population allows for significant changes to consumption on a nominal basis with small shifts on a per-capita basis. For example, light-vehicle sales in China are expected to be approximately 18 million in 2010. On a per-capita basis, this equates to 14 vehicles sold per 1,000 people. In the U.S., this figure is estimated to be 39 vehicles, while for the European Union it is around 27. Even if China doubles its light-vehicle sales
in the country from 18 million per year to 36 million, it will equal Europe's sales on a per-capita basis and still lag that of the U.S. by around one-third. As this example illustrates, the levels of China's consumption on a per-capita basis do not need to match those in developed regions in order for large nominal increases to occur. Even slight increases in penetration rates will have significant implications for companies selling products in these markets given the size of the population in China.
Investment Opportunities in Consumer Discretionary
Rising wealth across Asia creates a significant set of investment opportunities and we have highlighted the following four industries as examples.
I. Automobiles
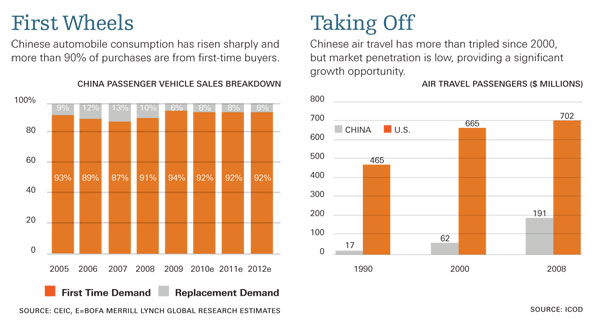
Expanding on the automobile topic, in 2009 China posted light-vehicle sales in excess of those in the U.S. for the first time in history-13.6 million versus 10.4 million. While the U.S. was facing the continued effects of the global financial crisis in 2009 and China offered incentives to boost auto sales, this change is nonetheless significant. Car sales in China are increasing and it is not due to replacement demand; the vast majority of auto purchases are first-time in nature, as indicated in the chart top left. JD Power & Associates has estimated that auto sales in China will reach 18 million in 2010, an increase of greater than 30% from 2009.While JD Power projects that the rate of growth will slow to 11% in 2011 due to the possibility of a reduction of Chinese- government incentives for vehicle purchases, a low double-digit increase in car sales figures is still impressive.In terms of unit sales, China currently represents the largest car market in the world-and that's before replacementdemand
begins to represent a significant part of the market.
Within the auto market, one significant trend is the acceleration of luxury-automobile sales. BMW's Rolls Royce division sold approximately 100 cars in China in 2009. In the first 10 months of 2010, 500 were sold. The automaker also recently stated that it may increase the number of Rolls Royce dealerships in the country from eight to 12. In addition, Porsche launched its first four-door sports sedan, the Panamera, in 2009 at an auto show not in the U.S. or Europe, but in Shanghai. Both actions clearly imply the significant opportunity that China offers automakers.
There are multiple opportunities for companies in the auto sector to benefit from greater penetration of autos amongst Asian nations. This includes publicly listed auto manufacturers based in China, as well as U.S., European, Japanese and Korean-based auto manufacturers that are capturing sales in the region. In fact, the companies with the top market share in China are General Motors, Volkswagen and Hyundai, all of which are obviously non-domestic auto manufacturers. While not seemingly as direct, yet still attractive, there are also compelling investment opportunities with respect to manufacturers of auto parts. As
investors, we seek to identify those companies that are not only growing sales, but gaining share in this expanding market. As a group, auto manufacturers are trading at a price/earnings multiple of approximately 11.7 and an EV/EBITDA multiple of 9.1 based on 2011 projected results. A peer group of comparable auto part suppliers is trading at a price/earnings multiple of 11.5 and an EV/EBITDA multiple of 8.7 based on next year's estimates.
II. Air travel
In 1980, China had less than 1% of the global airlinepassenger market. By 1990, China had 1.6% of the market (a total of 16.6 million passengers), the 12th largest market. By 2000, China had 61.9 million passengers and a 3.7% share, the fourth biggest. In 2008, China air passengers totaled 191 million, ranking second only to the U.S. which had 702 million passengers. (See chart on pg. 4) On a per-capita basis, this means that every Chinese citizen took an average of 0.15 trips via air per year, versus
the average of U.S. citizens of 2.3 trips, or 15 times as many flights as their Chinese counterparts. While the industry has grown significantly in recent years, penetration rates remain very low at just 17%, according to the Civil Aviation Administration of China.
The potential for increased air travel is also significant in surrounding Asian countries. Boeing has anticipated that traffic growth in Asia ex China will grow annually at a rate of 6.6% by 2029. By comparison, air travel within North America is expected to grow at 2.8% over that period.
As demand for air travel increases throughout Asia, the need for additional capacity is likely to be a tail wind for both Boeing and EADS's (Airbus) aircraft order backlog should they remain a duopoly of large commercial aircraft manufacturers. Regional aircraft manufacturers may also be beneficiaries. As a group, aircraft manufacturing companies are trading at a price/earnings multiple of 14.4 and EV/EBITDA multiple of 6.4 based on next year's estimates.

Other potential beneficiaries include aircraft equipment suppliers and service companies associated with aircraft maintenance and ongoing airline operations. Specialized material companies that supply milled and machined parts for both aircraft and engine manufacturers may also benefit.Several conglomerates including General Electric, Honeywell, United Technologies and Rolls Royce also have revenues associated with the aerospace sector (i.e., aircraft engines) and will likely benefit from the increase in air travel. Travel service and lodging companies will likely thrive, and air carriers, both international and Asianbased, will potentially reap the benefits of increasing air travel in Asia. Regarding valuations, aircraft equipment suppliers are trading at 14.8 on a price/earnings basis and at 8.1 on an EV/EBITDA basis. The four conglomerates mentioned previously are trading at an average price/earnings multiple of 14.4 and EV/EBITDA multiple of 10.2 based on next year's results. In aggregate, a group of peer travel service and hotel companies are trading with a price/earnings multiple of 27.5 and EV/EBITDA of 12.4 while the carriers trade at a price/earnings multiple of 11.8 and an average EV/EBITDA multiple of 5.7.
III. Gaming
Within China, the only place where gambling is legal is in Macau, a peninsula that is a one-hour ferry ride west of Hong Kong. Starting in the early 1960s, Macau's gaming operations were essentially a monopoly controlled by entrepreneur Stanley Ho, now one of the wealthiest individuals in Asia. Minimal investments were made into his casinos given the monopoly structure in place on the peninsula.
In order to foster competition, reduce petty crime and force modernization of the gaming facilities in Macau, the Chinese government auctioned off three gaming concessions in 2002. The three recipients of those concessions were Wynn, Galaxy Entertainment Group and Stanley Ho's SJM. Subsequently, three additional sub-concessions were granted to MGM/Pansy Ho, Las Vegas Sands and Melco.
Gross gaming revenues (meaning, the total amount of wagers) in Macau have exceeded the amount gambled in Las Vegas since 2007. Additionally, gross gaming revenues are expected to top $20 billion in 2010, or roughly twothirds of the total amount gambled in all commercial casinos in the U.S. Gross gaming revenues in 2010 grew by 33% and given the expanding middle-class and growing HNWI markets in Asia, gaming in Macau will likely continue to expand over the next several years.
The growth of gaming isn't just occurring in China; Singapore, for example, recently legalized gambling and granted licenses to two casinos in the country. These establishments opened in early 2010, and already, on a combined basis, gross gaming revenues in Singapore are expected to exceed those of Las Vegas in 2011.
All of the casino operators in Macau and Singapore are publicly traded, with some listed on regional exchanges and others part of Western gaming firms. As a group, the casino operators are trading at a median price/earnings multiple of 22.8 and an average EV/EBITDA of 12.9 based on next year's results.
IV. Luxury goods
Increasing wealth and higher disposable income in Asia has resulted in greater consumption of luxury goods. The Chinese,
in particular, are extremely brand conscious. As a result, both Western and European brands are capitalizing on this preference. A visit to Hong Kong's airport is evidence of this trend. While there are Starbucks and noodle shops, there are several luxury goods brands including Loro Piana, Hermes and Dunhill that have retail shops. Coach, the popular U.S.-based leather-goods manufacturer and retailer, has grown the number of its retail stores in China from 5 in 2005 to 49 currently, an increase of nearly 1000% in only a five-year time period. Sales in Asia for PPR's Gucci Group, the popular collection of high-end brands
known for its purses and bags, will be over one billion euros ($1.3 billion) in 2010 up from 600 million euros ($793 million)
in 2006, a 13% annual growth rate, with China representing approximately one-third of those sales. Among jewelry makers, Richemont is best known for Cartier, Van Cleef & Arpels and its collection of watch brands including Piaget, IWC and Jaeger-LeCoultre. As of its latest reporting period, sales to Asia represented 36% of total sales, while in 2006 the comparable figure was only 21%.
The expectations of growth in luxury good sales have resulted in strong performance for this group during 2010 as they returned on average 53%. On a valuation basis as a collective group, luxury goods companies are trading at multiples of 22.9 on a price/earnings basis and 13.1 on an EV/EBITDA basis.
Risk Scenarios
While the prospects for the Asian consumer are currently more favorable than those in developed regions, we are mindful of the risks to consumption.
One risk is inflation. While the Chinese government is taking various steps such as property restrictions and
stockpiling commodities to try to manage inflation, CPI was 4.4% in October 2010 and 5.1% in November 2010,
well above the government's target of 3%.
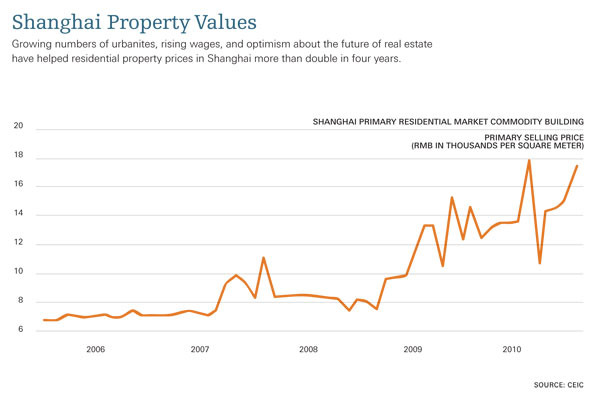
Another significant risk to the Asian consumer is the real property market. As the chart on pg. 6 shows, real estate prices in Shanghai have more than doubled since 2006. What's behind this steep increase? Culturally, the Chinese purchase property as an investment not only for current needs but also for future generations. This contrasts with Western investors who typically direct capital to liquid investments such as stocks and bonds. In addition, and most concerning, is the assumption that real estate prices will not decline. As we have seen in the U.S. and in Europe (Ireland and Spain in particular), real estate prices can decline precipitously.Should such a scenario occur, the repercussions would be significant as urbanization rates would likely decelerate and consumption would fall because the Chinese have such a significant amount of their wealth invested in real property. One ameliorating factor, however, is that Chinese buyers usually put down at least 30% cash when purchasing property, so a bear market in real estate is less likely to trigger a banking crisis, as happened in the developed West.
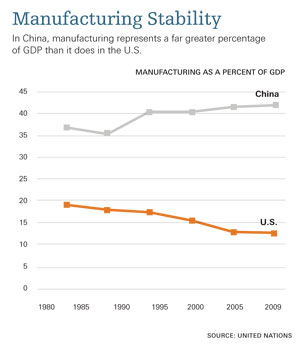
While the risks of both ongoing inflation and a property bubble in emerging Asia are significant, there are some factors that may mitigate these threats. One is manufacturing. In China, manufacturing represented more than 42% of GDP in 2009, according to the United Nations. By comparison, manufacturing in the U.S. currently stood at 13% of GDP. (See the chart above.) Additionally, labor in China is still cheap on a relative basis. Based on 2009 figures, per-capita income in the U.S. stood at $47,000 while China's level is about $3,600 per year, according to the World Bank. Even if Chinese wages rose 10% per year, it
would likely take 27 years for China's per-capita income to reach the current level of the U.S. Low relative labor costs should allow for manufacturing to remain strong in China.
Conclusion
While we are mindful of both the macroeconomic threats to emerging Asia (inflation and real estate) and the company-specific risks of investing in firms that have direct exposure to the region, we believe that investors cannot ignore the ongoing trends of urbanization and wealth generation in the region and the investment opportunities they create. The opportunity in Asia may well be one that may not come along again for another generation. While this is consistent with the consensus view, as investors our ultimate goal is to identify the most compelling opportunities at reasonable valuations.