


Tomorrow is the 29-year anniversary of the crash of 1987. After the dust settled, the S&P 500 fell an incredible 20.5% on Monday, October 19, 1987, for the single worst day ever for the index – earning the well-deserved nickname Black Monday. The Dow dropped 22.6% on Black Monday, the worst drop ever out of the 29,634 trading days since 1900 – topping the 20.5% World War I-induced drop on December 14, 1914. To put things in perspective, going back 115 years, only 10 times (and only twice since 1938) has the Dow closed down more than 22.6% for the entire year – let alone a single day.
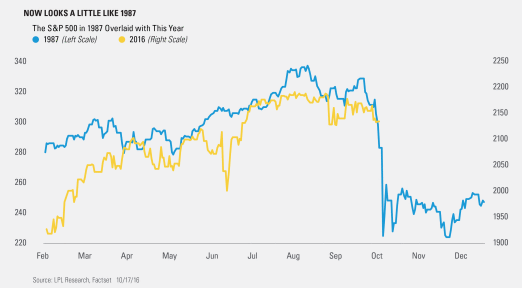
Here’s where things get interesting. A chart has been circulating trading desks recently that compares 1987 and 2016. As you can see below, the two are somewhat similar and should history repeat, a big drop would be due soon.
Could this happen? Anything is possible – but there are some major differences between now and ’87. Going back to ’87, there are still arguments over exactly what ‘caused’ the crash. The bottom line is ’87 saw a near vertical start to the year and was up close to 40% for the year at the start of September. In other words, stocks were extremely stretched – making a large pullback much more likely.
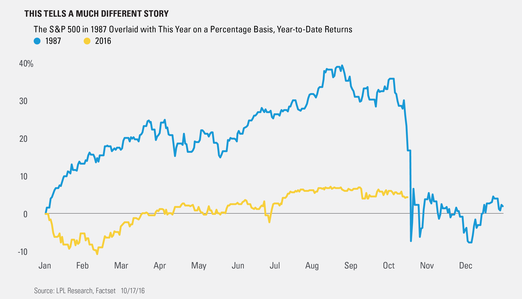
Now compare that with what this year has done versus ’87, but taking a look at the year-to-date percentage returns instead. This shows a totally different story and diffuses much of the worry about a coming 20% drop.
According to Senior Market Strategist Ryan Detrick, “Charts that compare one year to another pop up every few years and cause a lot of excitement. Who could forget the ‘now is just like ’29 charts’ we saw in early 2014? The bottom line is no two years are ever the same and to suggest they are is uninformed.”
Ryan Detrick is senior market strategist for LPL Financial.