


Key Points
- Conflicting comments by myriad Fed officials were blamed for Friday's rout; but one official's speech on Monday was credited with Monday's rebound.
- It's human nature to find an explanation for every market move; but investor sentiment may have been the biggest factor.
- Sighs of relief are natural; but a pick-up in volatility is likely here to stay for a while.
After a 51-day streak of days without the S&P 500 experiencing at least a 1% decline, the market hit a wall on Friday and was down 2.5% on a 40% jump in the volatility index (VIX). It was the worst single-day market decline since the aftermath of Britain’s vote to leave the European Union (Brexit) in June. But you lose some, you win some, and stocks staged an impressive 1.5% rebound on Monday.
Blame game
In terms of blame for Friday, fingers were pointed squarely at a variety of Federal Reserve officials. Conflicting comments from Federal Reserve Governor Daniel Tarullo and Boston Fed President Eric Rosengren likely contributed to investor skittishness. On Friday, Tarullo reiterated his caution about the economy and his dovish stance on rate increases. Rosengren suggested there was a reasonable case for a rate increase at the Fed meeting later this month. San Francisco Fed President John Williams, meanwhile, called for raising rates "sooner rather than later."
Outside the United States, the European Central Bank (ECB) opted last Thursday for no new easing moves and Japanese bond yields continued to rise. These two events sent a message to the markets that perhaps quantitative easing (QE) may have lost some efficacy and will not continue indefinitely.
And then there's Fed Governor Lael Brainard. She is being credited by some as contributing to both Friday's rout and Monday's rally. On Friday, there was a surprise announcement of the speech she gave on Monday. Having been considered a dove, some were worried her quickly setting up a speech a day prior to the Fed's quiet period suggested she was changing her tune. Instead she expressed concerns about the continued impact global stresses will have on the U.S. economy. Brainard mentioned that still-muted inflation and global uncertainty "counsels prudence in the removal of policy accommodation."
Third tantrum?
Many were worried Friday was setting up a third "tantrum"—the first being the "taper tantrum" in 2013, and the second being the tantrum which followed the Federal Reserve's initial rate hike last December. Monday's action eased those concerns…for now.
As you can see in the chart below, since the Fed's July meeting, expectations for a September rate hike have ranged from a low of 16% to a more recent high of 42% (settling in at 22% as of Monday's close). Unless the market begins to price in a higher likelihood of a rate hike in September, the Fed is unlikely to buck the market's expectations.
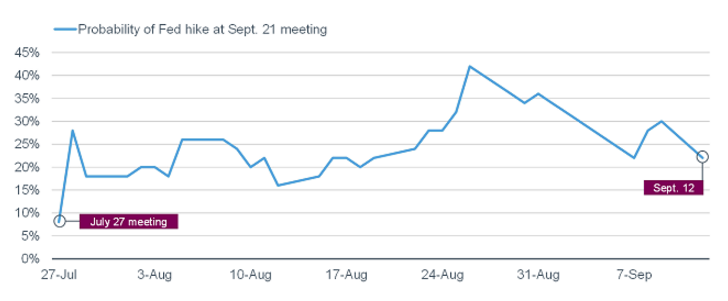
Source: Bloomberg, as of September 12, 2016.
Sentiment's setup
The media, more than most, persistently look for a narrative to explain every daily move in the market. It's rarely that simple. I believe the set up for the summer rally and this latest bout of weakness had as least as much to do with investor sentiment as it did with Fed policy uncertainty. In the immediate aftermath of the Brexit vote, investor pessimism hit historical extremes. Often at these extremes, not much of a catalyst is needed to boost stocks given the ample liquidity typically parked on the sidelines during an extreme phase of pessimism. That the world didn't immediately fall apart post-Brexit may have been all the market needed to launch its summer rally.
Fast-forward to the period leading into Friday's rout: sentiment had done an about-face and many measures had moved to extreme optimism. As I highlighted in my most recent report titled “All Summer Long,” complacency at best and frothy optimism at worst meant even a minor catalyst could trip up stocks. Whether Friday was it, it's too soon to tell; but I am keeping a close eye on sentiment conditions.
What does it mean looking forward?
After days like these, I find great tidbits on historic data from SentimenTrader (ST) and Bespoke Investment Group (BIG). When 50+ day streaks with no 1% moves in either direction have ended historically, stocks often saw follow-through selling over the subsequent couple of weeks—although that edge has diminished in recent years. You can see a summary table with data from ST since 1957 below.
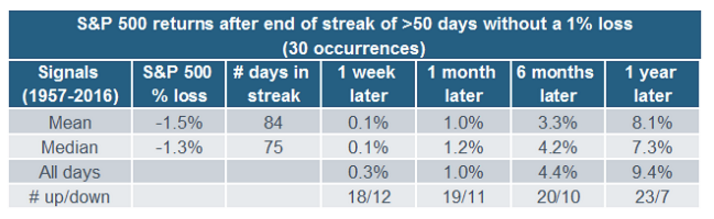
Source: SentimenTrader, as of September 9, 2016.
As noted, the drop was accompanied by a surge in the VIX. Previous large increases in the VIX led to inconsistent performance in stocks near-term, as you can see in the table below.
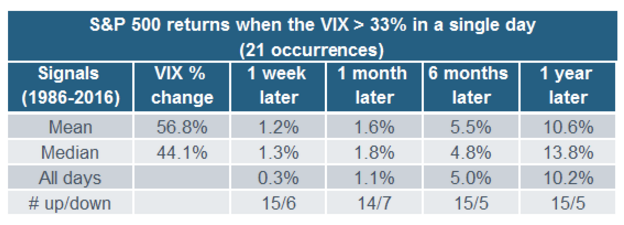
Source: SentimenTrader, as of September 9, 2016.
The VIX itself usually fell afterward, as you can see in the tables below. But as the second table shows, the losses were muted when the VIX surged, but remained at a relatively low level (which was the case this time).
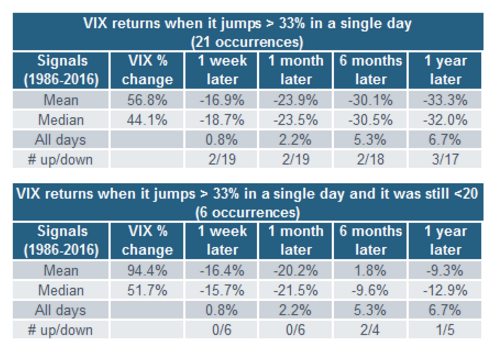
Source: SentimenTrader, as of September 9, 2016.
Regarding the dramatic rebound, over the past 50 years, there have only been nine instances when the S&P 500 fell by more than 2% on a Friday and then bounced by more than 1% the following Monday, according to BIG. The most recent example was in August 2007.
Historically, the S&P tended to pull back again over the next week and month; but did well in the immediate aftermath—like we saw today.
Fed policy loop alive and well
Over the course of the past year or so I've highlighted a concept constructed by Bank Credit Analyst (BCA) called the "Fed policy loop." I put together a graphic associated with this loop, which you can see in the chart below.
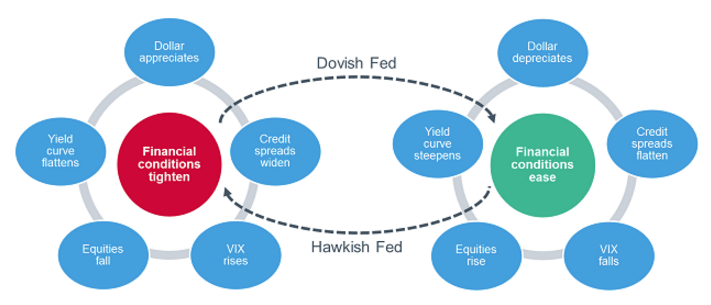
Source: BCA Research Inc., Charles Schwab.
Since the beginning of 2015, we have been in this loop—moving frequently between easy and tight financial conditions, which have triggered the moves between a dovish and hawkish Fed. As I've been saying for some time, I don't see how we extricate ourselves from this loop; while it's likely to remain a source of more frequent bouts of volatility.
Liz Ann Sonders is senior vice president, chief investment strategist at Charles Schwab & Co., Inc.