ExecutIve Summary
The historical benefits of managed futures investing have been well documented. As an investment strategy that has delivered positive absolute returns over time with very low correlation to traditional long-only strategies, coupled with a seemingly remarkable ability to perform best during periods of upheaval and financial crisis, managed futures have become increasingly popular as a core long- term diversifier for investors’ portfolios. After many years in which managed futures were restricted to ultra-high-net-worth individuals and institutions, the advent of lower-minimum hedge fund access and now mutual funds and ETFs have increased the availability of the strategy for the financial advisor community and the mass affluent market.
As is often the case in the investment world, an expansion of popularity and market reach has unfortunately coincided with a sustained period of disappointing performance for managed futures investors. Not only are many industry observers now questioning the efficacy of the strategy, but investors are re-examining their allocations to managed futures and the asset class’ place in their portfolios.
This is especially troublesome for investors who may be underweight equity markets, and are watching as equity indices successfully scale new heights on the wall of worry.
In this paper, we revisit the long-term performance characteristics of managed futures, and examine the specific market dynamics that we believe have created a difficult environment for the strategy post- Global Financial Crisis. Importantly, we look forward and ask whether it is time for those dynamics to begin shifting back in favor of managed futures investing.
Our Core ConclusIons:
- A long-term performance perspective helps to remind investors about the portfolio benefits of an allocation to managed futures, through multiple cycles.
- While performance drawdowns are frustrating, they don’t negate those long-term benefits— and drawdowns in managed futures have been relatively shallow when compared to traditional long-only asset classes.
- Trend following is the primary driver of managed futures returns. An index of trend persistence in markets may be turning positive.
- An end to volatility compression may help create conditions that are supportive of performance. Periods of sideways volatility generally coincide with positive performance, while periods of volatility expansion may potentially produce particularly strong returns for managed futures.
- Whipsawing between risk-on and risk-off environments constrains trend persistence. The prospect of a definitive outcome for the global economy, in either direction, creates opportunities for more trends to develop.
- Managed futures are one of the few strategies that can produce positive absolute returns in both falling and rising interest rate environments.
- Treasury bill yields historically form part of the managed futures return stream. With zero percent interest rates and no carry benefit, “true” or “excess” managed futures returns may still add considerable value to a stock/bond blend by reduc- ing volatility and increasing the Sharpe Ratio of the entire portfolio.
- We dispute the commonly voiced belief that the industry is “too big.” While the managed futures industry has grown in assets under management, the fact is, it continues to represent a fraction of overall futures market volume.
- We anticipate a performance recovery in addition to ongoing diversification benefits. We encourage investors to take advantage of the recent underper- formance of managed futures by considering initiating or adding to portfolio allocations.
Recent Performance Within A Long-Term Perspective
To say that managed futures have struggled over the past few years might seem patently obvious—the strategy has, after all, suffered negative calendar-year performance in three of the past four years, and delivered its first back-to- back losing years since 1990. However, examining market behavior over the past 20-plus years may help put the recent performance of managed futures into perspective, and provide investors with some comfort that current returns are not somehow a proverbial new normal.
Asset classes are, by their very definition, cyclical to varying degrees. So it is with managed futures—with the caveat that historical underperformance for the strategy has been: 1) infrequent and 2) relatively lower when compared to traditional long-only asset classes.
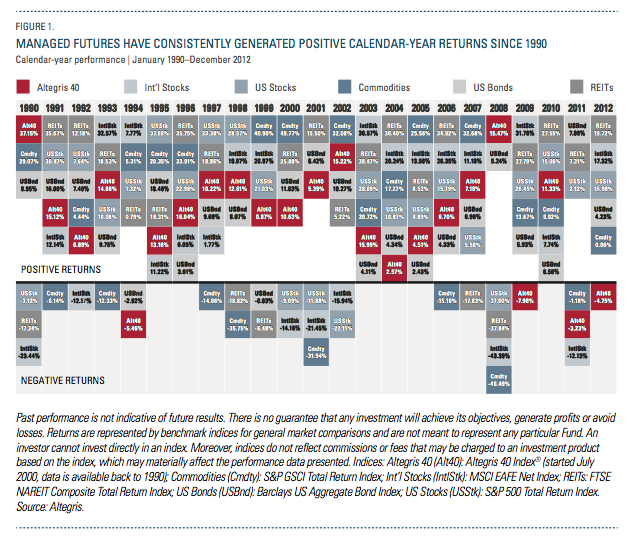
In fact, while past performance is no guarantee of future results, a key aspect of managed futures’ long-term profile is its track record of generating profits through a wide array of market cycles. To that end, managed futures have experienced positive returns in 19 out of the last 23 years (Figure 1).
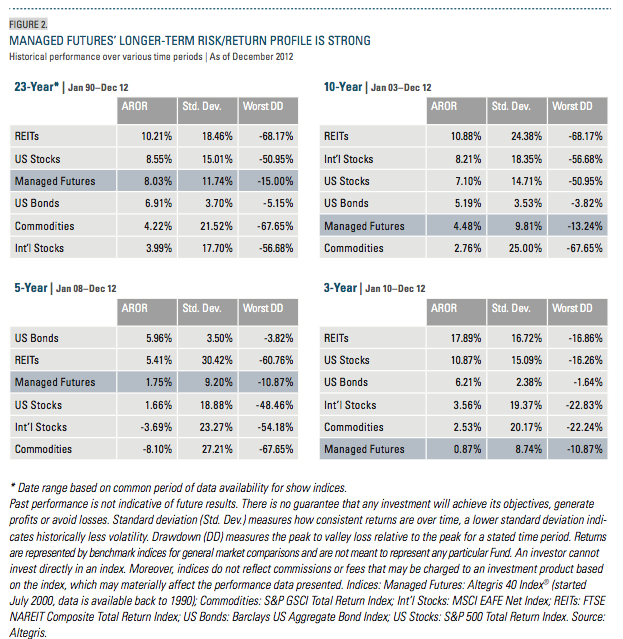
Delving further into these numbers, we see in Figure 2 an illustration of the extent to which managed futures have lagged the other major market indices over the last three calendar years on an annual return basis. However, over a longer timeframe, managed futures’ performance ranks much higher—slightly trailing US stocks, and beating out US bonds, commodities and international stocks since January 1990.
In addition, the table below shows that, even during the last three years, managed futures generated the second-lowest standard deviation and worst drawdown, respectively, compared to the other major asset classes—which is consistent with managed futures’ compelling risk profile over longer timeframes as well.
We believe that the unique risk/return characteristics of managed futures investing are revealed in this broader historical context, and that the key long-term role that the strategy can play in a diversified portfolio is reaffirmed.
A Leading Role For Trend Following
We view managed futures through the lens of the Altegris 40 Index®, which monitors the performance of the 40 leading managed futures programs based on month-end equity as tracked by Altegris (net of the manager’s fees, typically both management and incentive fees).1 Trend followers typically comprise 75% of the Index, while specialized managers make up the remainder. As this breakdown implies, managed futures have historically been dominated by trend following managers, whose performance— as their name suggests—is largely driven by capitalizing on trends as they develop.
David Harding, Founder and President of Winton Capital Management, has been successfully pursuing a trend following strategy for 25 years. He describes the efficacy of the approach by explaining that “when a market is going up, for example, it’s slightly more likely to carry on going up, rather than reverse and go down. And if you correctly invest in those trends over a long enough period of time, across enough markets, you can make money.” This has certainly been true for Winton, as well
as for many of its trend following peers.
Choppy markets and a lack of price trends, however, generally make it difficult for the majority of trend following managed futures managers to deliver strong risk-adjusted returns. And it just so happens that three of the past four years (2009, 2011 and 2012) have featured the three lowest trend-strength readings for a calendar year in history, according to the Rho Trend Barometer.
Developed by Rho Asset Management, the Rho Trend Barometer measures the percentage of markets with medium to strong trends.2 Just as a thermometer reading of 32 degrees Fahrenheit equates to freezing, when the Trend Barometer reads a value that is less than 43.3 percent, market trendiness begins to get “colder” or weaken. Likewise, when the Trend Barometer gets “hotter”—that is, moves above 43.3 percent—the more markets are trending.
As a result of this analysis, illustrated in Figure 3, we found that four of the five calendar years with a Trend Barometer value of less than 43.3 percent also— not surprisingly—saw negative performance for managed futures.
Digging deeper into the numbers, we found that 2009, 2011 and 2012 all witnessed unprecedented levels of non-trending months. Each year featured nine months in which the Trend Barometer value was less than 43.3 percent. In contrast, 2008 and 2003 had just six months apiece in which the Trend Barometer value was less 43.3 percent—not to mention, four months in each year in which the Trend Barometer value was above 60 percent, with corresponding returns for managed futures of 15.47 percent and 15.99 percent for the two years, respectively.
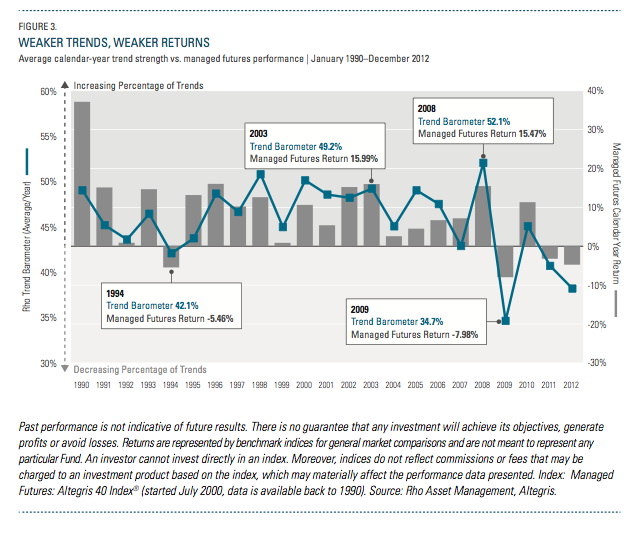
However, it’s also important to note that not every market needs to trend for trend followers to be successful. Indeed, the chart shows us that the best-performing years for managed futures have historically been when the Trend Barometer value is around 50 percent—meaning that just half of the markets had medium to strong trends on average during those years. The emergence of just a few sustainable trending markets, then, allows managers to build greater positions as trends further strengthen.
LookIng Forward: When WIll The Trend AgaIn Be Our FrIend?
Certainly, the recent performance of trend following managers must be judged in the context of conditions ranking among the most unfriendly in history for these strategies. To say the markets have lacked enduring trends would be an understatement—they have been, according to Winton in a recent letter to investors, “mean reverting more than at any point in the past 20 years.”
The good news is that all prior periods of exceptionally trendless markets have been short-lived. Many were followed by conditions punctuated by more durable trends—and the latter period of 2012 brought signs that such a transition might be in store. Accordingly, we believe that trends could very well move off their historic lows as measured by the Trend Barometer and begin to strengthen. Consequently, medium- and longer-term trend followers should be able to take advantage of more sustainable trends that could emerge.
This scenario becomes particularly important if markets start to trend downward, as trend followers (and managed futures managers in general) can profit from falling markets just as easily as rising markets.
At the same time, not all managed futures managers are trend followers—a significant subset are specialized managers, pursuing a wide variety of trading approaches, including discretionary macro, short-term systematic, countertrend and other strategies.
Interestingly, six of the 10 short-term systematic managers in the Altegris 40 generated positive returns in 2012. In marked contrast, only two trend following managers were up on the year. In fact, the only managers in 2012 that returned double- digit positive returns for the calendar year were two specialized managers—thus highlighting the importance of exposure to a diverse blend of elite managers as part of an investor’s total allocation to managed futures at all times, particularly during trendless or choppy markets.
The Mixed Blessing Of Low Volatility
Unlike traditional long-only investments, managed futures typically perform well in environments in which volatility is expanding. In fact, high volatility can be quite friendly to managed futures managers.
Svante Bergström, Founding Partner and Portfolio Manager at Lynx Asset Management, describes the ideal conditions for trend following managers: “When you have high volatility and stocks are falling, that tends to create trends not only in stocks, but also in fixed income and currencies and commodities at the same time. So that’s normally when you see us perform best.” Such was the case in 2008, a positive environment for managed futures in which the strategy returned 15.47 percent, while US stocks were down -37 percent.
Conversely, as volatility across markets starts to diminish or compress, managed futures managers usually find a more challenging environment—as they have in recent years.
While current levels of volatility are not out of the ordinary compared to other periods over the past 20-plus years, the range and length of time in which volatility has compressed over the past two years is only comparable to that seen in 2009, when managed futures delivered negative returns of nearly -8 percent.
Looking at stretches of time with neither volatility expansion nor compression, however, reveals an interesting discovery: intervals of essentially flat volatility have generally been positive for managed futures as well. In fact, periods of compressing volatility have proven to be the only times in which managed futures have consistently underperformed.
Figure 4 depicts historical volatility3 change from the previous year, as represented by the gray shaded area. An increase (volatility expansion) or decrease (volatility compression) simply means that volatility for a particular time period is greater or less than an earlier time period.4
Extreme periods of volatility compression (indicated by the red arrows) are when the volatility changes are greater than or equal to 20 percent and move from above zero (positive) to below (negative).
Likewise, extreme periods of volatility expansion (the blue arrows) are when the volatility changes are greater than or equal to 20 percent and move from below zero (negative) to above (positive).
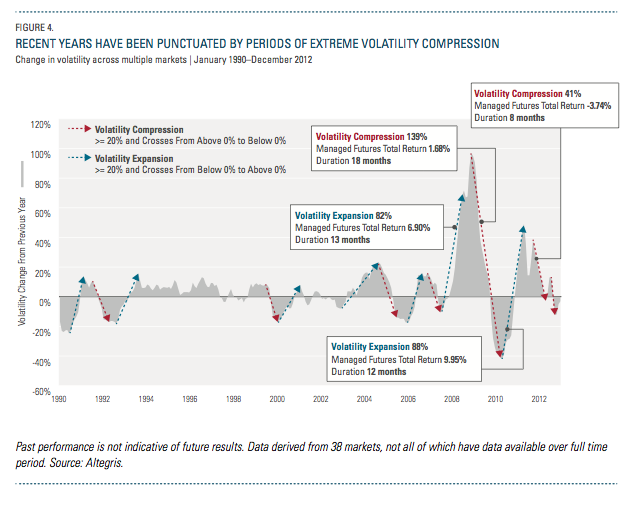
Clearly, there have been far more pronounced periods of volatility compression in recent years. As detailed in Figure 5, the level of volatility dropped a whopping 139 percent over 18 months beginning in November 2008, while the eight-month period beginning in September 2011 saw a drop of 41 percent.
The significance: During times when volatility is compressing, managed futures have historically not performed well. For example, during these two recent periods of extreme compression, managed futures delivered total returns of 1.68 percent and -3.74 percent, respectively.
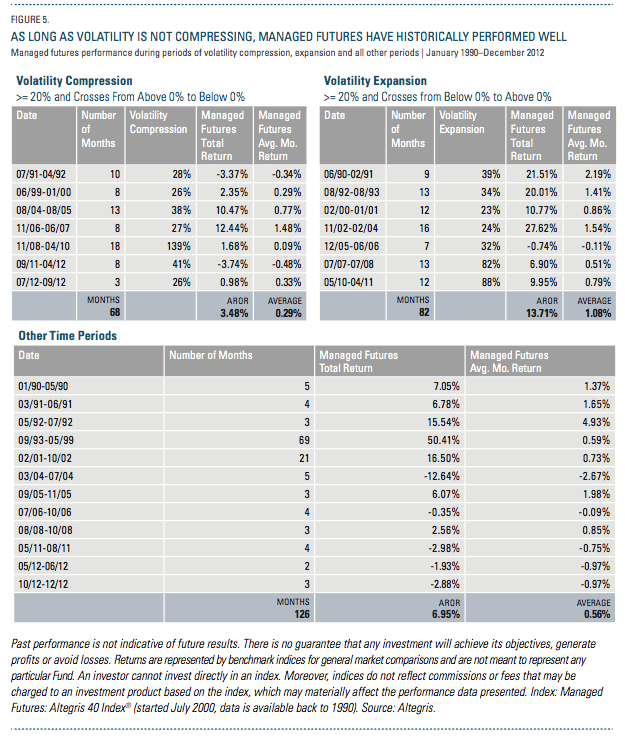
At the same time, the chart highlights managed futures’ equally prominent track record of positive performance during periods of rapidly expanding volatility.
For instance, managed futures delivered total returns of 6.90 percent and 9.95 percent during the two largest volatility expansion periods of the last 23 years—more than offsetting the underperformance during the most extreme compressions. In fact, as Figure 5 reveals:
- Managed futures during all periods of extreme volatility expansion delivered an annualized return of 13.71 percent, compared to 3.48 percent for periods of extreme compression.
- Further, we see that even during periods of flat volatility since 1990, managed futures still did quite well, generating an annualized return of almost 7 percent.
- Indeed, performance for the strategy was solid to spectacular across short, medium and extend- ed periods of flat volatility—15.5 percent during a three- month period in 1992, for example; 16.5 percent for the 21 months from February 2001 to October 2002; and 50.4 percent for the 69 months from September 1993 to May 1999.
In short: While managed futures historically under- performed during periods of extreme compression, they generally performed well amid flat volatility or really well during heightened volatility expansion.
LookIng Forward: When WIll VolatIlIty CompressIon End?
Volatility expansion or compression over the past few years has been “amplified” compared to the previous 20-plus years. While markets could continue to experience diminishing volatility, we believe it is more likely that they will start to see an expansion, given the recent historically low volatility levels. Such a shift would, of course, augur well for managed futures managers, particularly those pursuing trend following strategies.
But a shift to volatility expansion would not be the only possible catalyst for improved managed futures performance. As long as volatility simply stops compressing, the environment should be more favorable for managed futures.
Risk-On/Risk-Off: The Good, Bad And Ugly
Risk-on periods—which are perceived to be periods of positive returns for traditional long-only investments and general optimism in the markets— have historically been conducive to long positions in stock index and commodity futures, and short positions in interest rate futures and the US dollar.
On the other hand, risk-off periods—which are perceived to be associated with downturns in stocks and general negativity in the markets—are normally supportive of the opposite positions: long interest rate futures and the US dollar, and short stock index and commodity futures.
We have frequently discussed these pervasive risk-on and risk-off environments over the last few years. Just when it seemed that global markets were headed in a directionally positive manner, global shocks such as the Japanese tsunami in Q1 2011, the European debt crisis or the government spending clash in the US thwarted risk-on trends and reversed markets to more of a risk-off stance. Conversely, in the summer of 2012, when the risk-off trend was pervasive, Chairman Mario Draghi’s announcement of unlimited sovereign debt purchases by the European Central Bank created a positive reversal.
A bedrock principle of managed futures is that they simply require persistence of trends—in either direction—in order to potentially deliver strong returns. What presents challenges for managed futures managers is constant flip-flopping between risk-on and risk-off—as has been the case recently.
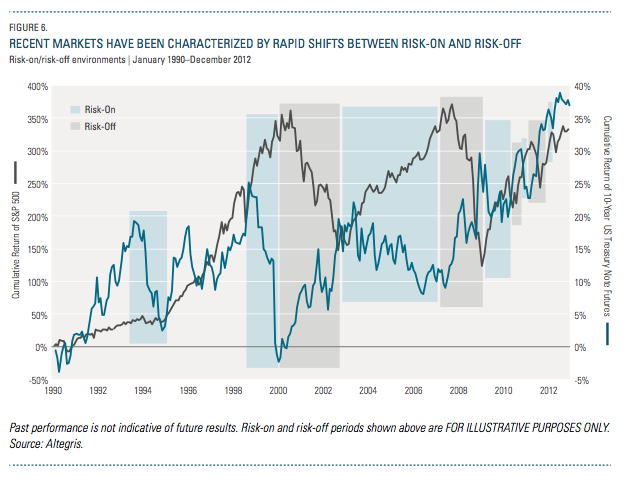
Figure 6 illustrates what we consider to be risk-on and risk-off periods. Timeframes that we characterize as risk-on are defined by periods in which the stock market is generating positive cumulative returns while fixed income markets exhibit declining cumulative returns. Risk-off environments typically occur when fixed income markets are generating positive cumulative returns while the stock market exhibits negative returns.
Our research reveals that times of positive performance in managed futures are typically driven by sustained periods of either risk-on or risk-off environments that supply markets with ample price trends. From a historical perspective, extended risk-off regimes from 2000 to 2003 and 2008 saw managed futures managers deliver total returns of 56 percent and 15 percent, respectively. Meanwhile, a persistent risk-on period from 2004 to 2007 saw that same group of managers produce returns of 23 percent.
The reality is that the post-financial crisis timeframe as a whole, as shown in the chart, has been characterized by frequent and unprecedented swings between risk-on and risk-off market environments. We believe the primary catalysts for this back-and- forth since 2009 have been “policy” factors that have resulted in markets often gyrating based upon the whims of politicians rather than underlying economic fundamentals. Excessive swings from “more risky” to “less risky” investments cause a lack of trends across various markets—thus preventing managers from taking advantage of persistent trends in either direction.
Looking Forward: A Post-Whipsaw Era?
The constant back-and-forth between risk-on and risk-off environments has obviously been problematic for managed futures, and trend followers in particular. While we are unsure if a transition to a risk-on or risk-off environment will occur, we think it’s likely that a sustained environment in one direction or the other will soon emerge—which would provide a welcome opening for managed futures managers as trends may begin to develop as a result.
Interest Rate And Managed Futures: A Tangled Web
With a sustained upward trend in bond prices (as a result of the extended downward trend in rates), fixed income has served as an important and profitable trend for managed futures managers to capitalize upon. However, a shift to a climate of rising rates, and concurrent downward trend in prices, could offer two significant benefits to managed futures investors as well. The first potential benefit involves managed futures managers’ ability to generate positive potential returns whether the overarching market direction is up or down.
A commonly held belief among industry observers is that managed futures only deliver strong returns when interest rates go down. But it so happens that managed futures have also experienced positive monthly returns during periods in which rates have risen and bond prices have fallen. This is because managed futures managers are agnostic to the direction of interest rates, and simply require an up trend or a down trend to potentially profit.
Figure 7 compares managed futures and US stocks’ returns during periods in which bond futures prices fall more sharply from one month to the next (as interest rates are rising). Historically, as rates rose more quickly, managed futures' returns imporved, while US stocks' performance deteriorated.
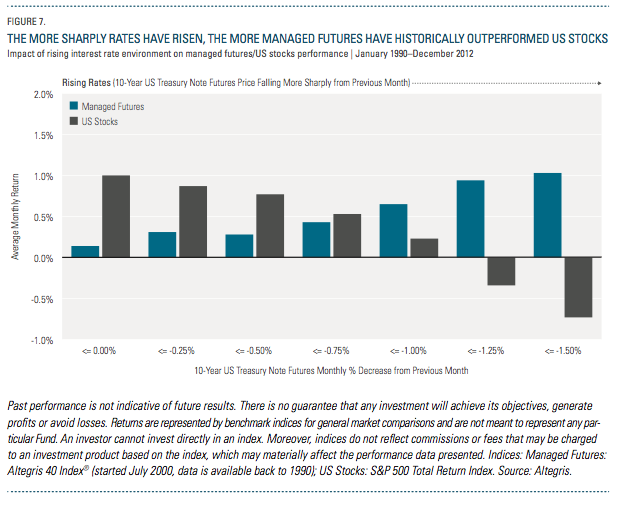
For example, managed futures returns on a weighted average monthly basis were 0.14 percent when rates merely declined, while US stocks returned 1.00 percent. Conversely, when rates were sharply rising, managed futures returned 1.03 percent on a weighted average monthly basis, while US stocks were down -0.73 percent.
If such a rising-rate market were to develop—which is far more a matter of when, not if—managed futures managers could find themselves in an enviable position.
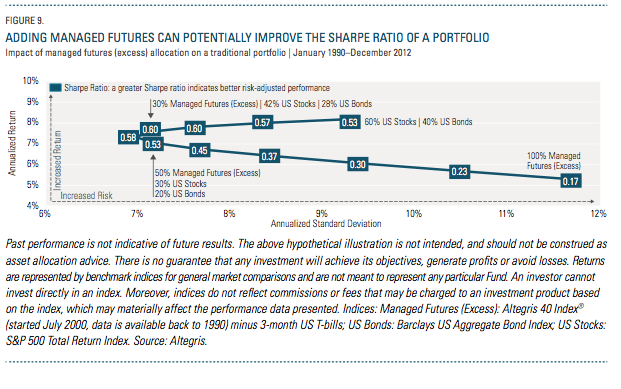
The second attribute of a rising-rate environment involves the yield on the cash collateral of a managed “excess” returns5) are clearly reduced—from 8.0 percent to futures portfolio. For example, a managed futures manager might have to put down 20 percent as collateral for margin requirements with a clearinghouse to gain 100 percent exposure to futures contracts. The 20 percent does not earn any income and is for collateral purposes only. However, the remaining 80 percent is generally invested in 3-month US Treasury bills, which earns the risk-free rate. A higher interest rate, then, means a higher return generated by the cash portion of a managed futures portfolio—which in turn means a higher contribution to the total managed futures return. Of course, the opposite is also true: A lower rate means a lower return from the cash portion of a managed futures portfolio.
The historical impact of the cash portion of a portfolio on managed futures is depicted in Figure 8. Without the cash portion invested in 3-month US T-bills, the returns of managed futures (referred to here asexcess” returns5) are clearly reduced—from 8.0 percent to 5.3 percent on an annualized basis.
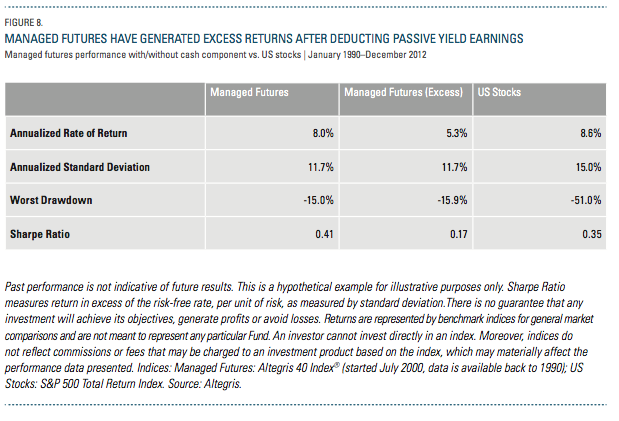
However, managed futures can add value to a traditional long-only portfolio even without the returns generated from cash. To further underscore this premise, Figure 9 represents an efficient
frontier of various hypothetical portfolio allocations to managed futures (excess), US stocks and US bonds. It illustrates that without the cash component earning income, the addition of managed futures to a traditional long-only portfolio provided a hypothetical portfolio with improved risk-adjusted returns (as measured by Sharpe Ratio).
One of managed futures’ most appealing characteristics is their rare ability—in any type of market—to provide returns that are uncorrelated to stocks and bonds.6 If managed futures returns without the enhancements of cash can potentially improve a portfolio due to its non-correlation benefits, what happens when a rising-rate environment once again elevates cash’s role as a return driver?
It’s an enticing—and altogether realistic—scenario, in which managed futures could potentially benefit from additional cash yield while at the same time capitalizing on strong trends.
LookIng Forward: RIsIng Rates, Increased OpportunItIes?
An extended low-interest-rate environment—with rates recently dipping to historic lows—has meant that the cash portion of managed futures has not generated excess returns. But if rates are poised to finally rise, two important consequences of potential benefit to managed futures investors should emerge:
- The opportunity for managed futures managers to capitalize on a down trend in bond prices and rising rates; and
- Higher returns for the cash portion of a managed futures portfolio.
Managed Futures Industry Growth: Fact And Fiction
We believe the four themes previously discussed represent the real drivers behind managed futures and the strategy’s recent performance. However, an argument that stubbornly resurfaces as a rationale for managed futures underperformance is that the industry has expanded too rapidly and grown too big, crowding trades and causing a lack of trends across markets.
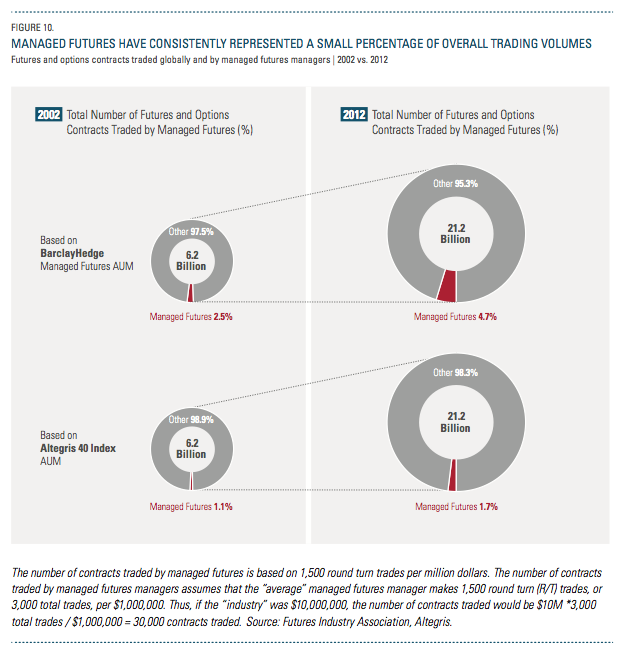
The growth of the managed futures industry over the past decade-plus is unquestioned—the space has expanded more than five times during this period (Figure 10).
The assets under management (AUM) of manager programs included in the Altegris 40 Index increased from approximately $23 billion in 2002 to $121 billion at the end of 2012. Meanwhile, another industry observer, BarclayHedge, estimates managed futures assets rose from $51 billion to
$330 billion during that same time.
We note that BarclayHedge’s figures include Bridgewater Associates, a discretionary global macro hedge fund ($130 billion in AUM), and other hedge fund managers that we believe may overstate the AUM of the managed futures industry and the volume of futures contracts traded. The lines of definition between a managed futures manager and a hedge fund are indeed sometimes blurry, so we don’t fault our friends at BarclayHedge, but for the purpose of considering whether trading volumes are affecting opportunity sets, we prefer to look at a narrower measure of the industry.
Regardless of how managed futures asset growth is quantified, when comparing the number of contracts traded by managed futures managers to the total number of futures and options across the globe, the impact from such growth seems minimal (Figure 10).
The number of futures and options contracts traded globally in 2002 was 6.2 billion. To put that into perspective, we estimate the number of contracts traded by managed futures managers that year was just 2.5 percent (using BarclayHedge AUM) or 1.1 percent (using Altegris 40 AUM) of the total.
Fast forward to 2012, when the total number of futures and options contracts traded globally was nearly 21.2 billion. And yet, the number of contracts traded by managed futures managers during that time was estimated at just 4.7 percent (BarclayHedge) or 1.7 percent (Altegris 40) of the total.
Thus, the number of contracts traded by the managed futures industry has represented—and continues to represent—a relatively small percentage of the overall volume of global futures and options contracts.
If the managed futures space was indeed growing too large, or too quickly, we believe that the percentage compared to the broader universe would be rising more sharply and representing a much larger slice of the total than it does currently. Even if one were to argue that a near-doubling of the value since 2002 (2.5 percent to 4.7 percent, in the case of BarclayHedge’s data) does indeed signal a rapid rise in managed futures trading, it still only constitutes a small portion of all contracts traded today.
LookIng Forward: BIgger, But Not Too BIg
According to managed futures manager Salem Abraham, the Founder and President of Abraham Trading Co., skeptics have long been sounding the alarm about the industry’s growth. “For over 25 years, people have always thought there’s too much money in the industry chasing too few trades,” he says. “Yet the market has grown so much bigger. There are so many more opportunities and so much more liquidity now.”
Indeed, the percentage of contracts traded by managed futures managers compared to all futures and options contracts traded globally has remained relatively small over the past 10 years—and we see no reason for that to change dramatically anytime soon.
As a result, we believe that the substantial growth of managed futures investment has not played a significant role in its recent underperformance.
A New Dawn For Managed Futures Investors?
The past few years—particularly 2012—have been undeniably difficult for managed futures. This period has essentially been a “perfect storm” for the space— based on the dearth of trends, amplified volatility compression, whipsawing between risk-on and risk-off market environments, and low interest rates.
Yet, the damage has been minimal, especially when compared to the history of other investments. Over the past 24 months,* managed futures performance is down -7.82 percent. To put that into context, the worst 24-month* period for US stocks produced a negative return of -45 percent.
So perhaps any perceived “crisis” in managed futures currently is not really a crisis at all. In fact, we would suggest that now might actually be a particularly opportune time to invest in managed futures, due to the themes we have discussed—the prospect of strengthening trends, heightened volatility, a more consistent perceived risk environment and rising rates.
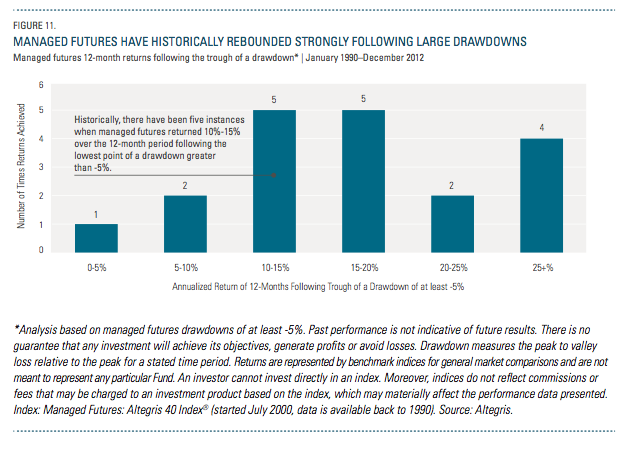
One additional reason for our optimism: Managed futures have historically performed strongly following large drawdowns—just like the recent period of underperformance.
Figure 11 illustrates how managed futures responded one year after the strategy experienced a drawdown of at least -5 percent. What the chart shows is striking: Managed futures delivered returns of at least 15 percent in more than half of the 12-month periods following large drawdowns like the current one. In fact, over the last 23 years, there were four periods in which the strategy generated returns of 25 percent or more over the 12 months following the troughs of these drawdowns.
Q1 2013 Lends Further Support
All of which begs the question: Could we be poised for another such period?
The first quarter of 2013 saw returns of +2.8 percent for the Altegris 40 Index. Compared to the gangbuster gains in stocks, where the S&P 500 was up 10.6 percent and the MSCI World up 7.2 percent, managedfuturesmanagers have been quietly generating positive returns from very diverse positioning in the markets. Most trend managers participated in the equity rally and the yen weakness, while reducing exposure to long positions in fixed income. In general, managers are now positioned cautiously “long” a risk-on position, but maintain substantial hedges to the potential for negative outcomes.
With the Rho Trend Barometer slowly reverting upwards to a level of 45 percent, and the previous 12 months indicating 3 percent volatility expansion compared to the previous year, the Altegris 40 Index has delivered positive returns in four of the past five months through the end of Q1 2013.
ConclusIon
We recognize that no one can time a market’s top and bottom perfectly—and those who maintain a long-term allocation to managed futures, in our view, have the opportunity to experience the most complete range of potential benefits offered by the strategy. And yet, we would be remiss if we didn’t at least acknowledge that, after such a challenging period, the simple investment philosophy of “buy
low, sell high” may ring no more true for managed futures than it does today. In that vein, we would echo the view of Stanley Fink, Chairman and CEO of ISAM—and 25-year industry veteran—when he says: “On a historical basis, the darkest hour is often before the dawn—it is after these choppy periods that some amazing trends start to emerge. I believe that we’re potentially at one of these points right now.”
So do we.
Footnotes:
1 Altegris calculates the dollar-weighted average performance of those 40 managed futures programs for the monthly Altegris 40 Index performance.
2 Please see www.rhoam.ch for more information about Rho Asset Management.
3 Defined by the aggregate standard deviation of 38 markets. Standard deviation is a statistical measure of how a consistent set of data are over time; a lower standard deviation indicates historically less volatility.
4 Illustrative Example: Volatility Compression
• Volatility of 78 percent for February 2009 indicates an increase in volatility of 78 percent compared to the previous year.
• Volatility of 53 percent for March 2009 indicates an increase in volatility of 53 percent compared to the previous year.
• Volatility of 38 percent for April 2009 indicates an increase in volatility of 38 percent compared to the previous year.
Thus, April 2009 volatility is weakening compared to February 2009 volatility (i.e., not increasing by as much).
Illustrative Example: Volatility Expansion
• Volatility of -29 percent for August 2010 indicates a decrease in volatility of -29 percent compared to the previous year.
• Volatility of -26 percent for September 2010 indicates a decrease in volatility of -26 percent compared to the previous year.
• Volatility of -12 percent for October 2010 indicates a decrease in volatility of -12 percent compared to the previous year.
Thus, October 2010 volatility is strengthening compared to August 2010 volatility (i.e., not decreasing by as much).
5 Managed futures (excess) returns are derived by subtracting the monthly interest income earned from the monthly return of managed futures (using the Altegris 40 Index). The “monthly interest income earned” is based on the assumption that 20 percent of cash in a managed futures portfolio would be posted as collateral and would not have earned the risk-free rate, while the remaining 80% would have earned the risk-free rate (using the 3-month US T-bill rate).
6 The historical correlation (January 1990–December 2012) of managed futures to US stocks and US bonds is -0.12 and 0.23, respectively. Managed futures represented by the Altegris 40 Index (started July 2000, data available back to 1990), US stocks represented by the S&P 500 Total Return Index, and US Bonds represented by the Barclays US Aggregate Bond Index.
-----------------------------
Index Descriptions
An investor cannot invest directly in an index. Moreover, indices do not reflect commissions or fees that may be charged to an invest- ment product based on the index, which may materially affect the performance data presented.
Commodities. the S&P GSCI Total Return Index measures a fully collateralized commodity futures investment and currently includes 24 commodity nearby futures contracts.
International Stocks. The MSCI EAFE Index is a capitalization-weighted index widely accepted as a benchmark of non-us stocks compiled by morgan stanley. it represents an aggregate of 21 individual country indices that collectively represent many of the major markets of the world.
Managed Futures. The Altegris 40 Index® tracks the performance of the 40 leading managed futures programs, by ending monthly equity (assets) for the previous month, as reported to altegris. the altegris 40 index represents the dollar-weighted average perfor- mance of those 40 constituent programs. the index started in July 2000; data is available back to 1990.
REITs The FTSE NAREIT Composite Total Return Index includes both price and income returns of all publicly traded REits (equity, mortgage, and hybrid). the index began on december 31, 1971 with a base value of 100.
US Bonds. The Barclays Capital U.S. Aggregate Bond Index represents securities that are sEc-registered, taxable, and dollar de- nominated. the index covers the u.s. investment grade fixed rate bond market, with index components for government and corporate securities, mortgage pass-through securities, and asset-backed securities. these major sectors are subdivided into more specific indices that are calculated and reported on a regular basis. these specific indices include the government/credit index, government index, treasury index, agency index, and credit index.
US Stocks. The S&P 500 Total Return Index, is the total return version of sSP 500 index. the S&P 500 index is unmanaged and is generally representative of certain portions of the u.s. equity markets. for the S&P 500 total return index, dividends are reinvested on a daily basis and the base date for the index is January 4, 1988. all regular cash dividends are assumed reinvested in the S&P 500 index on the ex-date. special cash dividends trigger a price adjustment in the price return index.
Glossary
Drawdown. A drawdown is any losing period during an investment time frame. it is calculated by taking the peak-to-valley loss relative to the peak for a stated time period. the figure is expressed as a percentage.
Long. Buying an asset/security that gives partial ownership to the buyer of the position. long positions profit from an increase in price.
Sharpe Ratio. Measures the return in excess of the risk-free rate, per unit of risk, as measured by standard deviation.
Short. Selling an asset/security that may have been borrowed from a third party with the intention of buying back at a later date. short positions profit from a decline in price. if a short position increases in price, covering the short position at a higher price may result in a loss.
Specialized. Trading programs that generally seek to capitalize on short-term market fluctuations, often using trend or counter-trend strategies with a shorter time horizon.
Standard deviation. A statistical measure of how consistent returns are over time; a lower standard deviation indicates historically less volatility.
Trend following. A core managed futures strategy that generally seeks to profit from the continuation of medium to long-term directional price moves in a market.
RIsks And Important Considerations
Altegris Advisors LLC is a CFTC-registered commodity pool operator, commodity trading advisor, and SEC-registered investment adviser that advises alternative strategy mutual funds that may pursue investment returns through a combination of managed futures, macro, equity long/short, fixed income and/or other investment strategies.
It is important to note that all investments are subject to risk that affect their performance in different market cycles. Equity securities are subject to the risk of decline due to adverse company or industry news or general economic decline. International stocks are often more risky than domestic stocks due to adverse economic, social, and political factors as well as differing legal and auditing stan- dards. Commodities are affected by adverse weather, geologic and environmental factors and heightened regulatory oversight. Bonds are subject to risk of default, credit risk, and interest rate risk; when interest rates rise, bond prices fall.
There are substantial risks and conflicts of interests associated with Managed Futures and commodities accounts, and you should only invest risk capital. The success of an investment is dependent upon the ability of a commodity trading advisor (CTA) to identify profit- able investment opportunities and successfully trade, which is difficult, requires skill, and involves a significant degree of uncertainty. CTAs may trade highly illiquid markets, or on foreign markets, and the high degree of leverage often obtainable in commodity trading can lead to large losses as well as gains. Returns generated from a CTA’s trading, if any, may not adequately compensate for the busi- ness and financial risks assumed. Managed Futures and commodities accounts may be subject to substantial charges for management and advisory fees. Past results are not necessarily indicative of future results. Mutual funds involve risk including possible loss of principal. An investment in an alternatives strategy mutual fund should only be made after careful study of the prospectus, including the description of the objectives, principal risks, charges, and expenses of the fund.
The analysis herein is based on numerous assumptions and past market conditions. Different benchmarks, market conditions and other assumptions could result in materially different outcomes. The reference to the statements or opinions of persons or firms not affili- ated with Altegris is intended for informational purposes only and does not constitute investment research, and should not be viewed as investment advice. The inclusion of such does not constitute endorsement, sponsorship by, or affiliation with Altegris with respect to any persons or firms named.
ABOUT ALTEGRIS
Altegris searches the world to find what we believe are the best alternative investments. Our suite of alternative investment solutions are designed for financial professionals and individuals seeking to improve portfolio diversification.
With one of the leading research and investment groups focused solely on alternatives, Altegris follows a disciplined process for identifying, evaluating, selecting and monitoring investment talent across a spectrum of alternative strategies including managed futures, global macro, long/short equity, event-driven and others.
Veteran experts in the art and science of alternatives, Altegris guides investors through the complex
and often opaque universe of alternative investing. Alternatives are in our DNA. Our very name, Altegris, highlights our singular focus on alternatives, the highest standards of integrity, and a process that constantly seeks to minimize investor risk while maximizing potential returns.
The Altegris Companies,* wholly owned subsidiaries of Genworth Financial, Inc., include Altegris Investments, Altegris Advisors, Altegris Funds, and Altegris Clearing Solutions. Altegris currently has approximately $3.24 billion in client assets, and provides clearing services to $843 million in institutional client assets.
*Altegris and its affiliates are subsidiaries of Genworth Financial, Inc. and are affiliated with Genworth Financial Wealth Management, Inc., and include: (1) Altegris Advisors, L.L.C., an SEC-registered investment adviser, CFTC-registered commodity pool operator, commodity trading advisor, and NFA member; (2) Altegris Investments, Inc., an SEC-registered broker-dealer and FINRA member; (3) Altegris Portfolio Management, Inc. (dba Altegris Funds), a CFTC-registered commodity pool operator, NFA member and SEC-registered investment adviser; and (4) Altegris Clearing Solutions, LLC, a CFTC registered futures introducing broker and commodity trading advisor and NFA member. The Altegris Companies and their affiliates have a financial interest in the products they sponsor, advise and/or recommend, as applicable. Depending on the investment, the Altegris Companies and their affiliates and employees may receive sales commissions, a portion of management or incentive fees, investment advisory fees, 12b-1 fees or similar payment for distribution, a portion of commodity futures trading commissions, margin interest and other futures-related charges, fee revenue, and/or advisory consulting fees.
Genworth Financial, Inc. (NYSE: GNW) is a leading Fortune 500 insurance holding company dedicated to helping people secure their financial lives, families and futures. Genworth has leadership positions in offerings that assist consumers in protecting themselves, investing for the future and planning for retirement—including life insurance, long-term care insurance, financial protection coverages, and independent advisor-based wealth management—and mortgage insurance that helps consumers achieve home ownership while assisting lenders in managing their risk and capital.
Genworth has approximately 5,850 employees and operates through three divisions: U.S. Life Insurance, which includes life insurance, long-term care insurance and fixed annuities; Global Mortgage Insurance, containing U.S. Mortgage Insurance and International Mortgage Insurance segments; and the Corporate and Other division, which includes the International Protection and Runoff segments and the wealth management business presented as discontinued operations. Products and services are offered through financial intermediaries, advisors, independent distributors and sales specialists. Genworth Financial, Inc., headquartered in Richmond, Virginia, traces its roots back to 1871 and became a public company in 2004. For more information, visit genworth.com. From time to time, Genworth Financial, Inc. releases important information via postings on its corporate website. Accordingly, investors and other interested parties are encouraged to enroll to receive automatic email alerts and Really Simple Syndication (RSS) feeds regarding new postings. Enrollment information is found under the “Investors” section of genworth.com