


Figure 1 illustrates the difference between saving to make a targeted amount with a 4% withdrawal rate (blue line) and the savings needed based on actual results. Pfau frames the blue line as an accumulation of 12.5X salary, which is the needed amount to have 50% of salary equal 4%. He calls the black line the lifecycle-based minimum savings rate needed to finance the desired expenditures (LMSR) and considers the black line the main contribution of his paper.
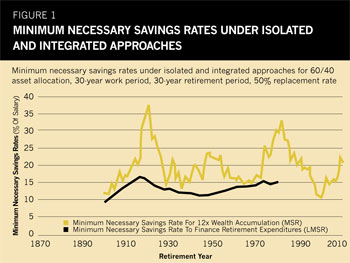
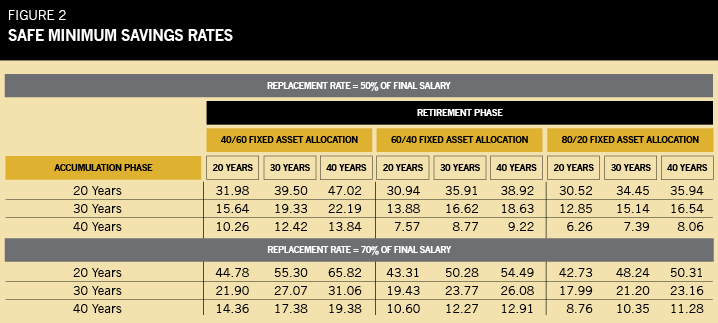
So what is "X" under the baseline case described earlier? Saving 16.62% of salary would have worked every time. Pfau's article also provides Figure 2, which shows results when certain variables change. It lays out 20-, 30- and 40-year savings spans, 20-, 30- and 40-year retirement periods, 40/60, 60/40 and 80/20 allocations, and replacement rates of 50% and 70%. For the typical 30-year retirement time frame, saving for 40 years cuts the safe savings rate to 8.77% while saving for only 20 years increases the safe rate to over 30%.
One reason for the much higher consistency of the needed savings is that good market environments tend to follow bad ones and vice versa.
Michael Kitces, author of The Kitces Report newsletter and the blog "Nerd's Eye View" at Kitces.com, has written and spoken about the effect of valuations on sustainable withdrawal rates. Low valuations portend better returns and therefore higher sustainable withdrawals. High valuations suggest lower withdrawal rates. Low valuations typically arise after weak market results.
Kitces' November 19, 2010 blog post pointed out just how much people with a specific accumulation goal at retirement depend on the last few years of savings to meet that goal. Using a straightforward calculation, Kitces found that a 25-year-old wishing to have $1 million at age 65 earning 8% needs to save $300 per month. Kitces points out, however, that at age 55, this saver still has less than $450,000. He quips that we would never say to a client that the plan was to "save for decades, build a base and then, in the last few years, quickly double up your wealth with investment growth and retire happily."
Two implications for planners of this reliance on compounding in the last few years leading up to retiring is that perhaps we should be advising clients to save more and/or preparing them for greater uncertainty about their retirement date if they insist on such a straight-line methodology. Pfau's paper suggests that by focusing on the percentage of income that needs to be saved and changing the time frame to one's lifetime instead of two distinct phases, tough years just prior to retirement may not be as problematic as one might fear from the near-retirement compounding problem.
Then again. At what initial withdrawal rate would a planner no longer be confident their client can retire? The numbers are what they are. We know everyone that saved at least 16.67% of their salary adjusted for inflation every year for 30 years was able to spend 50% of their final salary for at least 30 years, but none of these retirees or their advisors would have known what was to come at the time.
Dr. Pfau's blog, wpfau.blogspot.com, highlights a few specific retirees. The 1918 retiree, for instance, had to save the most (16.67%) to cover 30 years of retirement spending. The 1921 retiree had an initial withdrawal rate of 9.06%. How many of us would have sent this client confidently off into retirement at that point? There was no way to know then that the client could have made the next 30 years of spending with an initial withdrawal rate as high as 9.76%.