


This being a presidential election year, views on the economy vary widely. The labor market has improved substantially in the last few years, to the point where we are seeing some evidence of wage pressures. On the other hand, growth in inflation-adjusted Gross Domestic Product has been low by historical standards. Many Americans have not participated in the economic recovery, but most are better off than they were a year or two ago. At any particular time, some sectors of the economy will do better than others, and with a slower trend growth in GDP, some are likely to appear weak. This can create uncertainty about where the overall economy is headed.
In late summer, the Census Bureau releases its annual report on income and poverty. The latest figures showed that real median household income rose 5.2% between 2014 and 2015, the first annual increase since 2007 and the largest gain since 1967, when data were first compiled. Gains were widespread across categories (household type, race, age), with the lone exception of those outside metropolitan statistical areas (-2.0% y/y). Real median household income was still below where it was in 2007, before the recession began (also about where it was in 1998). However, it is moving in the right direction.
With a goal of being better able to manage the economy, the government began collecting economic data following the Great Depression. Naturally, these reports focused largely on the manufacturing sector. After WWII, manufacturing accounts form nearly one of three jobs in America. That percentage has drifted lower over time. Currently, manufacturing accounts for 8.5% of nonfarm payrolls (or about one in 12 jobs).
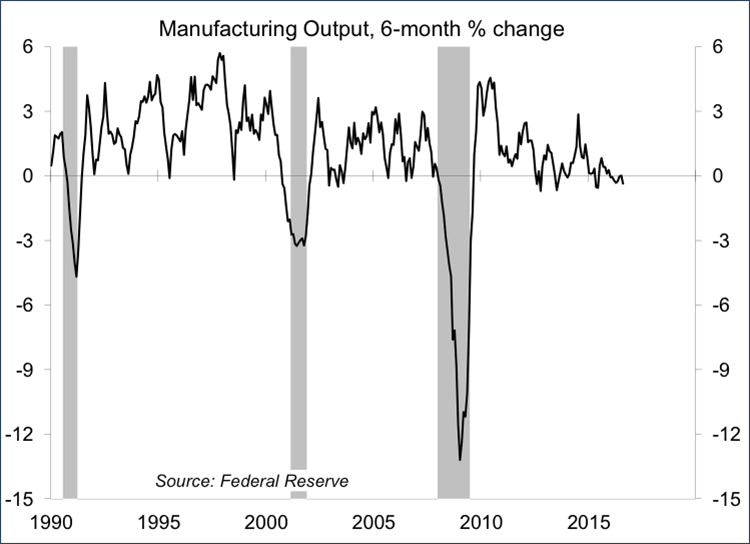
Industrial production has fallen 2.1% since November 2014, but that decline largely reflects the sharp drop in oil and gas well drilling (which fell 76% from December 2014 to May of this year). Energy exploration (which is capital intensive) has stopped falling, which means that the sector should no longer be a drag on business fixed investment and overall GDP growth. Factory output has been mixed, but generally soft, over the last several months, reflecting weak global growth and lower capital spending in the U.S. and abroad. Global growth ought to pick up, but the shifting demographics implies that labor input will grow more slowly than in recent decades.
However, there are benefits, as well as costs, to foreign trade. Tearing up trade agreements is likely to be counterproductive. Limiting cheap imports would boost inflation, reducing real incomes and dampening consumer spending growth. Retaliation would restrain U.S. exports, an increasingly important area of the economy.
Short-term bursts of GDP growth are possible. However, unless productivity growth picks up sharply or we substantially increase immigration, slower labor force growth will limit potential GDP growth over the foreseeable future.
Scott J. Brown, Ph.D., is chief economist at Raymond James & Associates.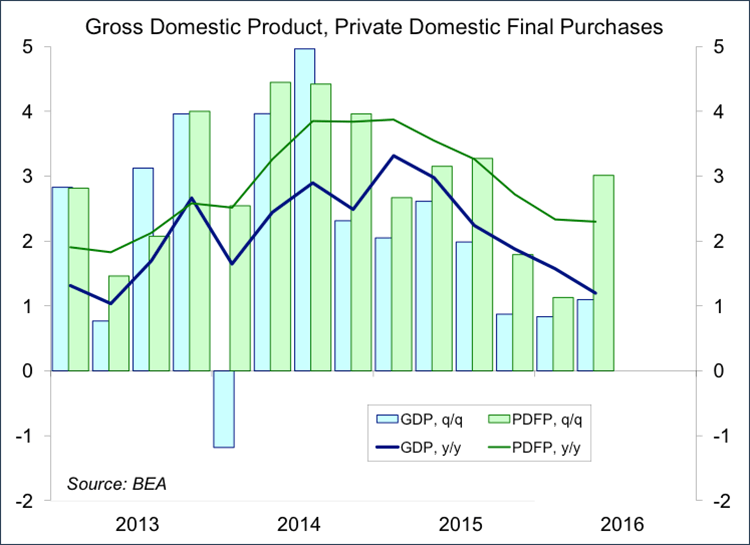
Real GDP rose 1.2% over the four quarters ending 2Q16. However, growth was restrained by slower (and more recently, declining) inventories. Final Sales (GDP less than change in inventories) rose 1.9%. And if you also exclude net exports and government (Private Domestic Final Purchases, a better measure of underlying demand), growth was 2.3%. Inventory growth is expected to pick up in the second half of the year, providing a short-term boost to overall GDP growth, but we saw little improvement in the data for July.
Foreign trade has played a part. In the 1980s, the U.S. lost about one of ten manufacturing jobs each year – but each job lost was replaced by a new job. For many years, low-end productivity jobs moved overseas and higher-productivity jobs were created to take their place. As Chinese exporting capacity ramped up in the 2000s, many U.S. manufacturing jobs disappeared and were not replaced.