KEY TAKEAWAYS
· The LEI provides a valuable monthly guidepost regarding where we are in the economic expansion.
· The LEI has to turn negative on a year-over-year basis to indicate a recession, which it has not yet done.
· Despite the weak reading in August 2016, we do not think the LEI is signaling a recession in the near term, although global and policy risks remain.
The Conference Board Leading Economic Index (LEI), one of our Five Forecasters, provides a valuable monthly guidepost regarding where we are in the economic expansion. We look at the month-over-month and year-over-year readings when analyzing the LEI. Although this indicator currently shows some weakness in its monthly and yearly readings, it has not turned negative. Based on our analysis, the LEI is not currently signaling a recession in the near term; however, we are continuing to closely monitor global and policy risks.
The latest reading on the LEI, based on August 2016 data, revealed that the index fell 0.2% between July and August 2016, and climbed only 1.1% since August 2015. The month-over-month change in the LEI has posted a positive reading in just 5 of the past 12 months, while the year-over-year change has decelerated from a high of 6.7% in July 2014 to the 1.1% today. This weakness has many observers concerned that the LEI is signaling a recession, but our analysis indicates that the year-over-year change in the LEI has to turn negative to indicate a recession. In our view, the recent weakness in the LEI reflects the lingering impact of the stronger dollar, the fall in oil prices and resulting decline in oil-related capital spending, and the general weakness in the manufacturing sector that has beset the U.S. economy since oil prices peaked in mid-2014. As we noted in our Midyear Outlook 2016: A Vote of Confidence, we expect many of those factors to fade in the second half of 2016.
The Five Forecasters
There is no magic formula for predicting recessions and bear markets—every cycle is different. But we believe the Five Forecasters cover a variety of perspectives and help capture a more complete view of the economic and market environment. They are meant to be considered collectively, not individually. For more on the Five Forecasters and other components we’re watching, see the latest Recession Watch Dashboard and this week’s Weekly Market Commentary.
What does the LEI represent?
The LEI is designed to project the probable path of the economy 6–12 months in the future. Since 1960, a span of 680 months (or 56 years and 8 months), the LEI’s year-over-year increase has been at least 1.1% (as it was in August 2016) in 475 months. Not surprisingly, the U.S. economy was not in a recession in any of those 475 months. Thus, the odds that the U.S. economy was in recession in August 2016 are close to zero. As we’ve noted in prior commentaries, when the economy has not been in or near a recession, the S&P 500 has been positive 82% of the time and provided low-double-digit returns. When the economy has been in a recession, the S&P 500 has been positive just 50% of the time, with average returns in the low-single-digits.
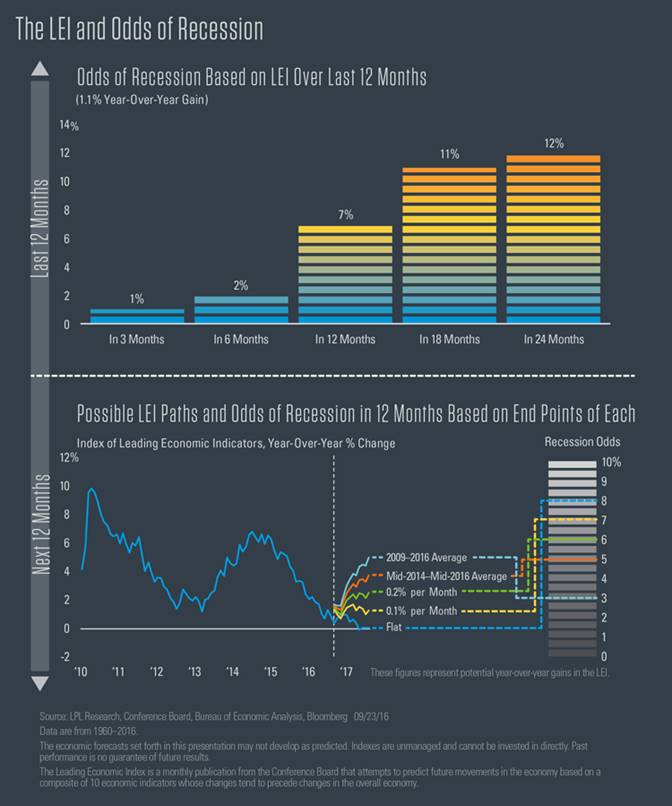
But the LEI is designed to forecast the potential direction of the U.S. economy and tell market participants what may happen, not what has already happened. Three months after each of the 475 months that the LEI was up 1.1% or more, the economy was in a recession just three times. Six months after the LEI rose by 1.1% or more year over year, the U.S. economy has been in a recession 10 times, or 2% of the time. Looking out 12 months after the LEI was up 1.1% or more, the economy was in a recession in just 31 of the 475 months, or 7% of the time. Based on this relationship, the odds of a recession within the next 18 months and 24 months are 11% and 12%, respectively [see the first chart in the infographic on page 2]. Thus, despite the recent weakness in the LEI, the forward-looking economic indicators suggest that the odds of a recession in the next couple of years are very low.
What is the LEI suggesting for what’s ahead?
So, what happens next? Perhaps the LEI—past and present—can help answer that question. The deceleration in the LEI in mid-2014 coincided with the rise in the dollar, the drop in oil prices, and the subsequent decline in oil-related capital expenditures and manufacturing. Since then, the average monthly gain in the LEI was 0.2%, which is just below the average monthly gain in the LEI (0.3%) during the last three economic expansions (1982–1990, 1991–2001, 2001–2007). If the LEI averages a 0.2% increase per month over the next 12 months, in August 2017, the year-over-year increase in the LEI would be 2.4%; this would suggest that the odds of a recession in the 12 months ending in August 2018 would be just 6%. If the LEI averaged 0.3% per month in the next year—matching what it averaged during the prior three economic expansions—in August 2017, the year-over-year increase in the LEI would stand at 3.6%, putting the odds of a recession in the 12 months ending in August 2018 at just 5%.
However, we believe the U.S. economy has the potential to pick up some steam in the coming quarters—not by much, but some—and could match the recovery to date gross domestic product (GDP) growth rate of 2.0–2.5%. During that time (mid-2009 through today), the average monthly gain in the LEI was 0.4%. If sustained over a full year, the 0.4% gain would translate into a robust 4.8% year-over-year gain in the LEI in August 2017, which would put the odds of recession occurring by August 2018 at just 3%. The infographic (the second chart) also shows what the LEI would look like a year from now if it averaged 0.1% per month, a pattern that would accompany very stagnant economic growth.
It is possible that the LEI may not move at all. Perhaps the uncertainty around the U.S. election outcome or the negotiations around Brexit—which are slated to start in early 2017—may impact growth; or a sharply stronger dollar could put renewed downward pressure on oil prices, capital spending, and manufacturing; or a policy mistake at home or abroad, including a misstep by China in its handling of its bad debt problem, may negatively impact the U.S. economy. In that case, no change in the LEI would put the odds of recession occurring between August 2017 and August 2018 at just 8%.
On balance, the LEI, even at just 1.1% year over year, says the risk of recession in the next 12 months is very low (7%), but not zero. Although the odds of a recession increase when looking out 18 months (11%) and 24 months (12%), they remain low—but again, not zero. We note that economic expansions do not generally die of old age, but end due to excesses building up in one or more sectors of the economy. In the past, overbuilding in housing or commercial real estate, borrowing too much to pay for overbuilding and overspending, or even overconfidence by businesses and consumers have all led to overheating and recession.
Conclusion
The current recovery has been relatively lackluster by historical standards, and the excesses that have triggered recessions in the past are not present. Still, a dramatic deterioration of the financial or economic situation abroad, a fiscal or monetary policy mistake here in the U.S. or abroad, or an exogenous event (a major terror attack, natural disaster, etc.), among other events, may cause us to change our view.
John J. Canally Jr., CFA, is the chief economic strategist at LPL Financial.