The cash-flow-reserve portion of the portfolio represents approximately two years' worth of spending and is equally divided between a short-term municipal bond fund and a municipal money market account (5% each). A short-term (5-year) municipal bond fund is used since it may provide a higher income stream with a historically limited level of volatility. The cash-flow reserve receives income generated from the various investments and is also the source from which the monthly spending check is written by the retiree for deposit into their checking account.
Within the investment portfolio there is an additional 25% or approximately four to five years of spending allocated to intermediate-term (10-year) municipal bonds, which can be liquidated if there is a protracted decline in the equity markets. These municipal bond investments can help provide a more tax-efficient income stream and some good diversification benefits to the growing dividend stock strategy. Although the income from municipal bond investments is exempt from regular federal and state income tax, they may be subject to the alternative minimum tax (AMT).
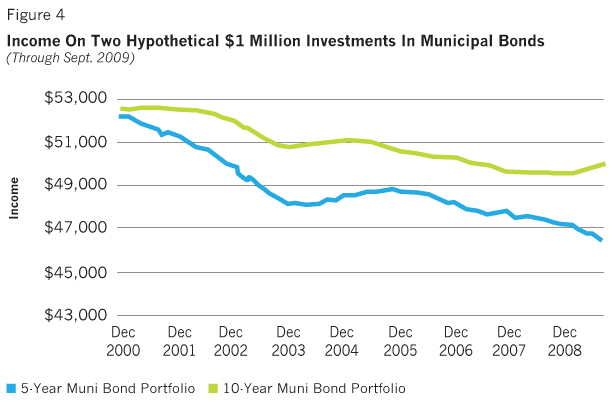
In terms of income expectations from the municipal bond investments, while the current level of income may be relatively attractive, they are not geared to grow. A common flaw of retirement portfolios is an over-allocation to fixed-income investments, leaving the portfolio highly susceptible to the loss of purchasing power. This is clearly illustrated when analyzing the level of income these municipal bond investments would have generated on a hypothetical $1 million investment made in 2000. As shown in Figure 4, the income level actually declined.

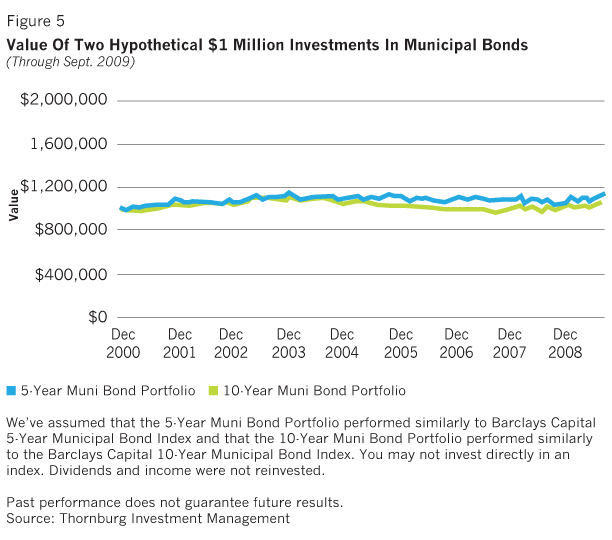
Although these objectives may not be met, principal protection is the primary goal for including municipal bond investments in the cash-flow reserve and investment portfolio rungs, with income as a secondary objective. While the level of income declined from 2000-2009, the principal of a hypothetical $1 million investment made in 2000, assuming no reinvestment of dividends, was actually very stable (Figure 5). This stability of principal can complement the more volatile equity investments made in growing dividend strategies.

The equity allocation within the investment portfolio represents 65% of the total allocation. This investment is made with a minimum horizon of five years and is therefore positioned in the third rung, or far right-hand side of the cash-flow-reserve ladder. This 65% allocation will be invested in growing dividend equity investments and separated into two distinct pieces. The first is a 15% allocation to a hypothetical portfolio of domestic dividend growers and the second is a 50% allocation to a hypothetical portfolio of global dividend growers. The domestic Dividend Growers portfolio performed similarly to the S&P 500 Dividend Aristocrats Index. This index is provided by Standard and Poor's and includes the 52 companies (for 2009) in the United States that have increased their dividend payouts for 25 consecutive years. The Global Dividend Growers portfolio performed similarly to the S&P Global Dividend Opportunities Index. This Index represents 100 exchange-traded common stocks from around the world (including the U.S.) that offer high dividend yields. Given that the Global Dividend Growers portfolio includes an approximately 23% (subject to change) allocation to the United States, we have used a 15% allocation to the domestic Dividend Growers portfolio to achieve approximately 65% international, and 35% domestic allocations to dividend paying companies. As we briefly discussed at the end of the Value of Dividends in Retirement section of this kit, using a global approach to investing in companies that provide growing dividends allows an opportunity to improve portfolio diversification by industry, sector, and country.
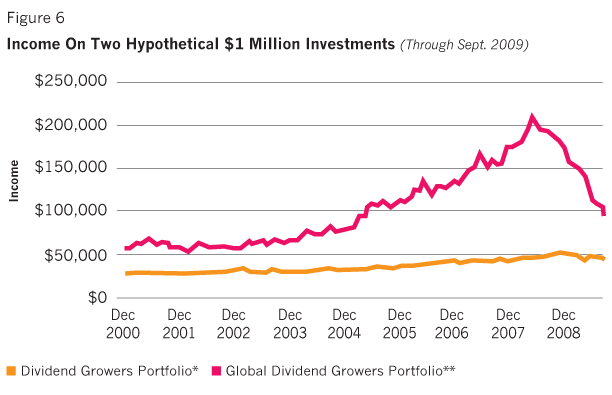
These allocations to dividend-focused strategies were chosen for their historic ability to provide an attractive level of current income plus the possibility to grow the income over time. Illustrated in Figure 6 is the annual income from a $1 million investment made on January 1, 2000, into the hypothetical domestic Dividend Growers portfolio and the Global Dividend Growers portfolio.

What is readily apparent from the chart is the growth of income provided by the Global Dividend Growers portfolio. While the growth has been dramatic on the upside, it has also experienced a decrease since mid-2008. The volatility can be attributed to the sole focus of the portfolio on the top dividend-yielding stocks versus a more diversified investment approach. What is less apparent on this chart is the slower but steady increase of income provided by the hypothetical domestic Dividend Growers portfolio. This portfolio includes only those companies that have increased their dividend for each of the past 25 years, so they have a tendency to be more established and stable.


