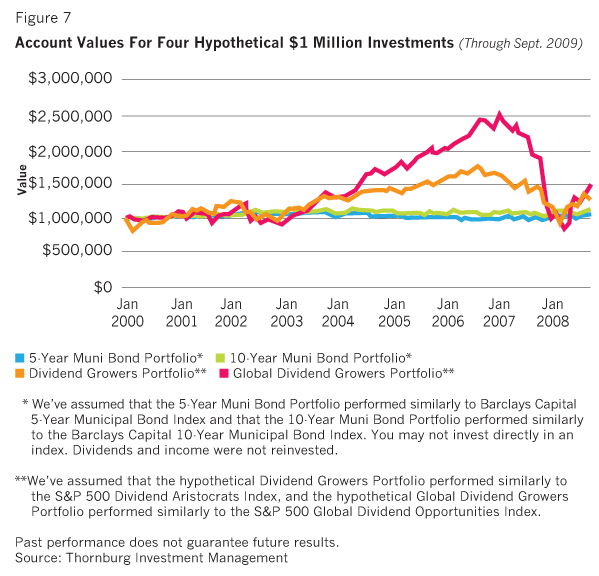
While these dividend grower strategies historically provided a growing dividend stream, they also historically provided the ability for the portfolio to grow based upon price appreciation alone. Shown in Figure 7 is a comparison of the value of $1 million investments made on January 1, 2000, in the hypothetical dividend growers portfolios versus the investments in the two municipal bond portfolios, assuming no reinvestment of income.

Note that while the equity investments declined in value during the bear markets of 2000-2002 and more recently in late 2007-2008, they also provided strong appreciation from 2003 to late 2007, and turned positive once again mid-2009. Also note how the municipal bond portfolios remained relatively stable during the periods of decline in the dividend growers portfolios. Using the cash-flow-reserve ladder, with its focus on maintaining two years of liquidity in the reserve, together with an allocation to municipal bonds, allows the portfolio to benefit from the growing dividend income stream while also alleviating the need to sell these more volatile equity investments at inopportune times.
Pulling It All Together
Now let's look at combining the different investment portfolios we have discussed into a globally diversified hypothetical portfolio. This portfolio will consist of a 5% allocation to a municipal money market fund; 5% to 5-year muni bonds; 25% to 10-year muni bonds; 15% to domestic dividend growers; and 50% to global dividend growers. So, let's measure the effectiveness of our plan by using this hypothetical Globally Diversified Portfolio with the cash-flow-reserve ladder. Return to the chart used in Figure 1, which shows the annual spending for the 2000 retiree. In Figure 8, we now show the spending level as well as the source of the funds used to support the spending. The dark blue portion of each bar represents the income generated by the portfolio, the gold portion represents the principal redeemed via asset sales, and the green represents excess income provided by the portfolio beyond what is needed for spending.

In 2000, the retiree spent a total of $50,000; spending was increased in subsequent years to account for inflation. Note how the growing income stream represented by the green portion of the bar reduces the amount of principal redemption needed through 2004. Subsequent to 2004, there was no need to redeem principal since the hypothetical portfolio generated more than enough income to cover the spending. This excess income was retained in the investment portfolio. As recapped in the table below the chart, total dividend and interest earned during the period was $617,813; the retiree spent $550,695, leaving $67,118 of excess income in the portfolio. And while this portfolio has provided the increasing level of income to cover spending, the value of the initial $1 million investment has grown to $1.468 million as of September 30, 2009.
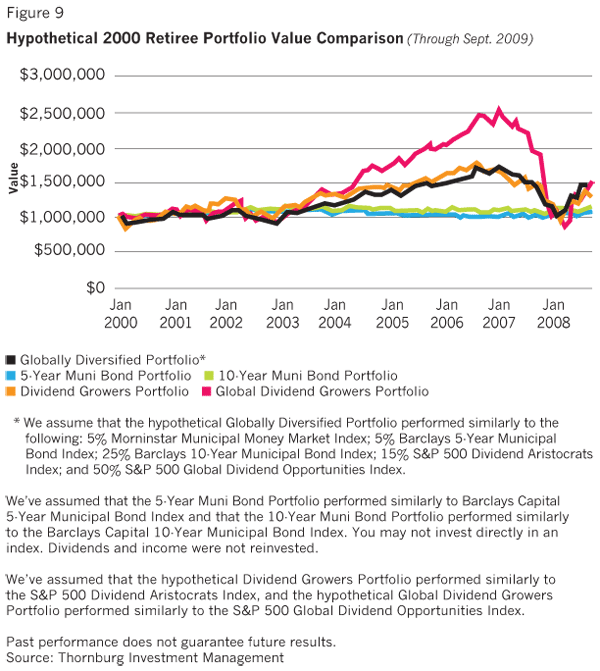
It should also be noted that while the portfolio is valued at $1.468 million as of September 30, 2009, this value has changed since the 2000 retirement. In Figure 9 we compare the hypothetical account value for our Globally Diversified portfolio versus the various municipal bond and growing dividend portfolios. What is remarkable is that the Globally Diversified portfolio is less volatile than the dividend growers portfolios, but with much better growth than the municipal bond portfolios.

The hypothetical portfolio value actually fell below $1 million on several occasions during 2000-2003, as a result of a challenging time in the equity market. However, the use of the cash-flow-reserve ladder and a globally diversified portfolio focused on a growing income stream allowed the retirement portfolio to generate the majority of the income it needed during that time without having to sell significant assets and suffer the effects of reverse dollar-cost averaging.
Notice how the portfolio value declined again beginning in mid-2007 through early 2009, since it was impossible to escape the turmoil affecting the financial markets. However, with the portfolio generating a sufficient level of income to cover spending needs during 2007 and 2008, once again the portfolio was kept intact to benefit from the recent recovery in the investment markets.
Best Practices
This structured process for converting hard-earned retirement savings into a monthly spending amount should be attractive to the majority of baby boomers looking to retain control of their assets in retirement. One of the best ways to increase the potential for a higher dividend income stream at the time of retirement is to get a head start. Three to five years before your planned retirement date, begin investing in a well-managed, globally diversified portfolio of high and growing dividend stocks. Reinvest the growing dividend income that's generated before the retirement begins, thereby buying more shares and increasing the level of dividend income available when retirement distributions finally do begin. And remember to revisit the retirement plan annually with your financial advisor.
Visit the Online Extras section of our Web site to read Part 1, Part 2, Part 3 and Part 4 of this series.
Jack Gardner is the president of Thornburg Securities Corp., distributor of the Thornburg family of mutual funds, and a managing director of Thornburg Investment Management, the advisor to the funds. Gardner is a Certified Investment Management Analyst and Accredited Investment Fiduciary Analyst, and holds a B.S. degree in accounting from Stonehill College and an M.S. in computer information Systems from Bentley College.


